|
-- Weekly Market Update for the Week Commencing 8th September 2003
Forecast
Summary
 The
Latest Forecast Summary (no change from previous update) The
Latest Forecast Summary (no change from previous update)
Big Picture
View
Here is a summary of our big picture
view of the markets. Note that our short-term views may differ from our
big picture view.
Bond yields (long-term interest
rates) reached a major low in June of 2003 and will trend higher until
at least mid 2004.
The US stock market will reach
a major bottom (well below the October-2002 low) during 2004.
The Dollar commenced a bear
market in July 2001 and will continue its decline during 2003 and 2004.
A bull market in gold stocks
commenced in November 2000 and will continue during 2003 and 2004.
Commodity prices, as represented
by the CRB Index, will rally during 2003 and 2004 with most of the upside
occurring in 2004.
Monetary
Policy Under Uncertainty
On 29th August Alan Greenspan gave
a speech in which he explained why it is no longer appropriate to use economic
models to determine the correct monetary policy. Rather, according to Greenspan,
the complexity and ever-changing relationships within today's economy mean
that a flexible risk management approach must be adopted with a key element
of this approach being the judgement of policy-makers. The speech can be
read in its entirety at http://www.federalreserve.gov/boarddocs/speeches/2003/20030829/default.htm.
The above-mentioned speech is another
in a long line of thinly veiled attempts by Greenspan to re-write history
and to portray the Fed as an innocent observer of the build-up of massive
imbalances within the US economy (as opposed to the important facilitator
of these imbalances which it really was). Some aspects of the speech are,
however, worth reviewing at TSI because they provide clues regarding how
things could have become so messed up.
The first clue is contained near the
start of the speech when Greenspan talks about devising "a strategy
for policy directed at maximizing the probabilities of achieving over time
our goal of price stability and the maximum sustainable economic growth
that we associate with it." When Greenspan and many other analysts
refer to price stability they are referring only to the stability of price
indices such as the CPI. However, the greatest asset price bubbles tend
to occur during periods when consumer prices are stable and these bubbles
have devastating after-effects.
The second clue is contained in the
following extract from the speech:
"Recent history has also reinforced
the perception that the relationships underlying the economy's structure
change over time in ways that are difficult to anticipate. This has been
most apparent in the changing role of our standard measure of the money
stock. Because an interest rate, by definition, is the exchange rate for
money against non-monies, money obviously is central to monetary policy.
However, in the past two decades, what constitutes money has been obscured
by the introduction of technologies that have facilitated the proliferation
of financial products and have altered the empirical relationship between
economic activity and what we define as money, and in doing so has inhibited
the keying of monetary policy to the control of the measured money stock."
We certainly agree that new types of
money have proliferated over the past 10 years and that the traditional
measures of money supply no longer come close to fully accounting for all
the varieties of money sloshing around the economy. However, in spite of
the many monetary/credit innovations, M2 and M3 (the traditional measures
of money supply) continue to work very well as indicators of monetary trends.
For example, the CPI-adjusted M2 growth rate was a reliable leading indicator
of economic growth over the past 50 years and has continued to be a reliable
leading indicator over the past 5 years. Also, M3 continues to do a perfectly
fine job of indicating the rate at which the total stock of money is growing.
The real issue isn't that the traditional
measures of money supply are no longer adequate, it is that analysts in
general and policy-makers in particular refuse to perceive excessive money-supply
growth as an inflation problem unless consumer prices are rising at a rapid
rate. If the inflation is pushing up asset prices it is not generally perceived
to be a problem. However, the truth is that excessive money-supply growth
ALWAYS causes prices to rise somewhere in the economy and ALWAYS has adverse
consequences.
The third clue is the irony of someone
who didn't recognise the great stock and credit market bubbles for what
they were, and who, by his own admission, believes that it is only possible
to identify bubbles with the benefit of hindsight, telling us that the
Fed's risk management practice relies, to a significant extent, on his
personal judgement. Risk management involves putting things in place today
to prevent a crisis from happening in the future. It doesn't involve reacting
to crises after they happen.
The fourth clue is the underlying assumption
that the only choice we have is between a central bank setting short-term
interest rates using rigid models or a central bank setting short-term
interest rates using a vague and flexible risk-management approach. It
never ceases to amaze us how people who comprehend why it would be impossible
for a bunch of bureaucrats to do a better job than the market of setting
the price of something as simple as tomatoes fail to see how ridiculous
it is to give a bunch of bureaucrats the power to set the price of something
as complex as money.
Copper
Update
We are bullish on copper as far as
the next year is concerned, but are neutral as far as the next month is
concerned. This is because the copper price is poised right at important
resistance, a likely place for a pullback to begin.
Bond Market
Update
Last week we said "even if the intermediate-term
downward trend [in the Japanese Government Bond market] remains in place
it would be normal for the JGBs to find support at around the 136 level
and rebound back to 138-139."
Even if a support level is destined
to hold, a market will often spike below it (to punish those who react
to breakouts) before rebounding. As the below weekly chart of Japanese
Government Bond (JGB) futures shows, this is exactly what the Japanese
bond market did last week. Specifically, the JGBs spiked well below the
obvious support at 136 early in the week and then rebounded sharply to
close the week at 137. If the rally that began last week is just a counter-trend
move within a continuing intermediate-term downward trend then the JGBs
should NOT achieve a weekly close above 139.
Note that we are focusing on the JGBs
because the Japanese bond market exerts a strong influence on the other
major bond markets of the world.
The US
Stock Market
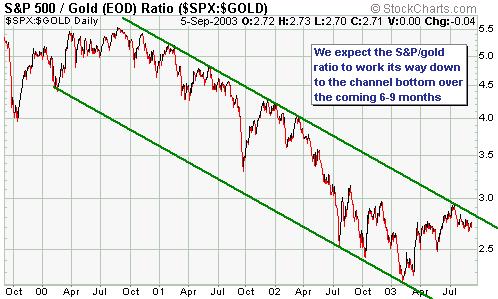
The 'real' S&P500 Index
Below is a chart showing the S&P500
Index in terms of gold. Regardless of what happens to the nominal S&P500
Index, our view is that the S&P500 has peaked relative to gold. This
is because the S&P500 can only be supported near current levels by
on-going rapid dollar inflation and gone are the days when financial assets
were the primary beneficiaries of this inflation. Actually, it is difficult
to see how even a further increase in inflation will help support the S&P500
near current levels beyond the short-term. This is because as soon as the
inflation becomes obvious in the prices of non-financial assets it results
in higher long-term interest rates and lower average price/earnings ratios.
In any case, the channel top for the
S&P500/gold ratio is very well defined. Given the fundamental backdrop,
as long as the channel top continues to hold it will make sense to anticipate
a drop to the channel bottom before the next major rally commences.
Current Market Situation
Because last week's new recovery highs
in the major US stock indices were confirmed by indicators such as the
NASDAQ100/Dow ratio, we doubt that a peak in the US stock market is already
in place. As discussed in last week's Interim Update, we consider the most
likely scenario to be a sharp pullback over the next few weeks followed
by a rally to a new recovery high late in the year before a major decline
gets underway. The next most likely outcome is that the market continues
directly higher from its current levels and makes a major top during the
next few weeks.
Below is a 1-year chart of the S&P500
Index. If our preferred scenario is correct then the S&P500 will close
below the short-term support that exists at around 1010 during the coming
week and begin working its way down to intermediate-term support in the
900-950 range. However, if 1010 holds on a daily closing basis over the
coming week then the alternative scenario mentioned above will become the
most likely scenario.

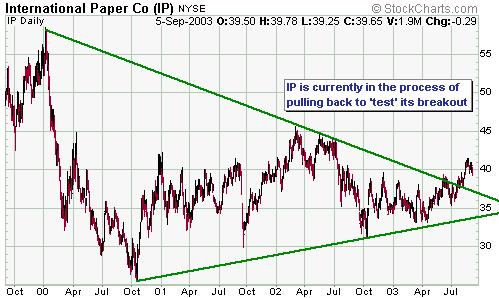
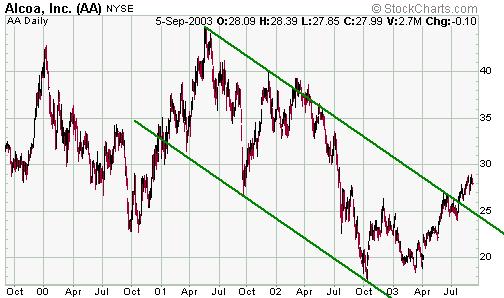
In last week's Interim Update we explained
that the current chart pattern of Kinross Gold (TSX: K) was not the type
of pattern we'd expect to see for this stock if a peak in the gold sector
was imminent. Similarly, the below charts of International Paper (NYSE:
IP) and Alcoa (NYSE: AA) show patterns that we would not expect to see
if the commodity-cyclical sector of the stock market was close to a major
peak. These charts are, however, consistent with the view that a pullback
will occur over the next few weeks.
This week's important economic events
| Date |
Description |
| Monday Sep 08 |
Consumer Credit |
| Tuesday Sep 09 |
No significant events |
| Wednesday Sep 10 |
No significant events |
| Thursday Sep 11 |
Trade Balance
Import / Export Prices |
| Friday Sep 12 |
PPI
Retail Sales |
Click
here to read the rest of today's commentary

|
