|
-- for the Week Commencing 8th October 2001
Forecast
Summary
 The
Latest Forecast Summary The
Latest Forecast Summary
Big Picture
View
Here is a summary of our big picture
view of the markets. Note that our short-term views may differ from our
big picture view.
Bond yields (long-term interest
rates) will move higher into 2002.
The US stock market is in the
process of making a major bear market bottom.
The Dollar will head lower into
2002.
A bull market in gold stocks
commenced in November 2000 and is likely to extend into 2002.
Commodity prices, as represented
by the CRB Index, are in the process of bottoming. The CRB Index will reverse
higher by the first quarter of 2002 (at the latest) and then rally over
the ensuing 1-2 years.
The oil price will resume its
major uptrend by January 2002.
Another
Inflation Play
We are confident that the central banks
of the world will be successful in their mission to avoid deflation, because
how could they not be? How could institutions with unlimited power to create
money, including the power to monetise every public and private sector
debt in the land if they chose to do so, not be able to depreciate their
currencies via inflation if they really set their collective minds to the
task? The US Fed has certainly set its mind to the task. No doubt aware
that the supply of money is more important than the cost of money, the
Fed is working hand-in-glove with the private banks and the GSEs (Government
Sponsored Enterprises) to rapidly expand the US money supply. This money
supply expansion is inflation. One of the effects of this inflation
will be higher prices somewhere within the economy (unless this
turns out to be the first time in the history of the world that a large
and sustained increase in the supply of money does not lead to higher prices).
The investment landscape has undergone
a change over the past 2 years and the major beneficiaries of the inflation
of the late 1990s will not be the major beneficiaries of the inflation
of 2001 and beyond. Of all the changes that have occurred we think the
one with the greatest long-term significance is the downward reversal in
the US Dollar's exchange rate. The US Dollar's rising trend over the past
several years made dollar-denominated financial assets irresistible to
investors outside the US and has helped suppress commodity prices in US$
terms. As long as the Dollar was strengthening there was little incentive
to hoard commodities because it was perceived that commodity prices (in
US Dollars) were not going to be any dearer in the future than they were
in the present. With the US$ having probably embarked on at least an intermediate-term
downtrend, we think the greatest effect of this current bout of inflation
will be seen in the prices of commodities.
Gold, due to its monetary quality,
is usually the first commodity to respond to an inflation-induced rise
in commodity prices (gold will sometimes respond 1-2 years in advance of
such a trend change). So far this year we've seen good relative strength
in the prices of gold and gold stocks, something that is consistent with
our view that a bull market in commodities is likely during 2002 and 2003.
If we are correct then it is still very early in the new cycle and gold
should remain our major focus for now. However, it is not too early to
start thinking about the next opportunity: copper.
Copper has been in use for about 7,000
years and, nowadays, is used in everything from telecommunications to refrigeration,
from lighting to industrial valves, from electronics to automobiles, from
aircraft to plumbing and heating, from coins to power generation and countless
other applications. However, despite copper's widespread and growing usefulness
throughout the economy the copper price is, today, little changed from
where it was 20 years ago. Over the same period the Dow Jones Industrial
Average is up by over 1,000%. In inflation-adjusted terms, the copper price
is probably lower now than it has ever been.
Copper's historically-low price has
led to the closure of copper mines and will probably lead to further reductions
in mine supply over the coming months. It is likely that the mines that
have been and will be closed will not be re-opened until after the copper
price has moved much higher and has demonstrated an ability to stay at
that higher level. As such, any increase in demand resulting from the massive
inflation that rages behind the scenes and the planned increases in government
spending (the military build-up plus the misguided attempts to stimulate
the economy via greater spending on infra-structure) should have an out-sized
effect on the copper price. Note that the copper price will begin to move
up in advance of any increase in demand for the physical commodity because
speculators in the futures markets will anticipate such changes in demand.
So, what is the best way to profit
from the coming bull market in copper? In our opinion, becoming a part-owner
of the world's second-largest copper producer (Phelps Dodge, NYSE: PD)
is a good option.
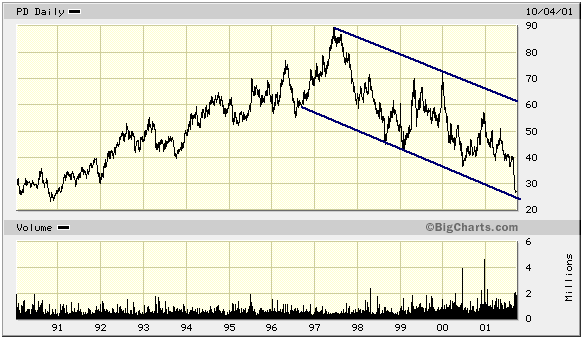
The dismal performance of the copper
price since 1997 is reflected in the following chart of Phelps Dodge. PD
is now trading at a level not seen since the 1990-1991 recession.

It is preferable to buy stocks after
they have pulled-back within an overall up-trend. However, buying a cyclical
stock after it has just reached its lowest price in 10 years and is close
to the bottom of a long-term channel can also work well.
PD's current market cap is about $2B.
At this year's depressed copper price its total sales are going to be around
$4B. This means that a 10% increase in the copper price will add roughly
$400M to PD's pre-tax cash-flow and a 10% decrease will subtract $400M
(this is not strictly correct since PD does not generate all of its revenue
through the sale of raw copper, but is a reasonable assumption for our
back-of-the-envelope calculation). In other words, PD offers huge leverage
to the copper price - its market cap is very small compared to the amount
of money it could make or lose if the copper price moves by only 10%.
We are going to immediately add PD
to the TSI Portfolio. We are confident that the stock price will be much
higher in 12 months time than it is now, but the risk is we could be a
few months early. As discussed in last week's Interim Update the copper
price bottoms, on average, about 3 months after long-term interest rates
bottom. Based on last week's bond market action it is likely that bond
yields are in the process of making at least a short-term low (which is
why we turned short-term bearish on bonds last week), but at this stage
we can't rule out the possibility that even lower yields will be seen over
the coming months before a major bond bear market gets underway. As noted
in previous commentary we think that now is a reasonable time to start
building positions in a few of the major commodity producers, but it is
certainly not the time to mortgage the last 40 acres and put the proceeds
into commodity plays.
The US
Stock Market
Current Market Situation
The week of September 17-21 saw such
extremes of bearish sentiment (as measured by a number of reliable sentiment
indicators) and selling pressure that even if the market is destined to
reach even lower levels in the years ahead the Sep-21 lows are unlikely
to be penetrated for some considerable time (at least 6 months). The fear
was palpable in the days following the market's re-opening on Sep-17, with
months of selling and margin liquidation condensed into 5 days. The selling
pressure was made more intense than it would otherwise have been by insurance
companies dumping part of their stock holdings in preparation for claims
related to the Sep-11 disaster.
Although last Friday's close for the
S&P500 Index was about 14% above the Sep-21 intra-day low, fear still
prevails judging by the way traders run for cover (the cover provided by
put options) at the first sign of trouble. The overall put/call ratio was
0.96 on Friday, an extraordinarily high level for a day on which the major
market indices finished in positive territory. This suggests that any pullback
towards the Sep-21 lows in the near future will be a successful test of
those lows rather than the start of another bear market leg.
Our view was and is that an important
bottom for the market was created by the waterfall decline that ended on
the morning of Sep-21, but that a test of the Sep-21 low would occur by
the end of October. With everyone in the world expecting such a test (the
bulls expect a successful test, the bears expect an unsuccessful test),
the likelihood is that the market will find support at a level that is
comfortably-above the recent lows and then rally anew. Note that although
we say "comfortably-above", it won't feel comfortable for anyone with substantial
long-side exposure since a decline to a higher low will initially look
the same as a plunge to new lows.
So far, things are coming together
as they should if the Sep-21 bottom is going to endure beyond the short-term.
In particular, the latest COT Report showed that the Commercial net-short
position had fallen to 43,000 contracts as at Oct-02, down 40,000 contracts
in the space of 12 trading days. Furthermore, the Japanese stock market
is showing signs of having turned higher. When the US stock market pulls-back
to test its lows it will be important that the Nikkei also finds support
above its lows of the past few weeks.
It looks to us like the market began
its 'testing' pullback last Thursday morning after the December S&P500
futures contract spiked up to 1087, with news regarding the potential for
more tax cuts giving the market a temporary boost on Friday. We bought
one position in the QQQ (NASDAQ100 Trust) on Sep-25 and plan to add another
position during the coming weeks if we see the sentiment, technical and
inter-market evidence we are looking for to confirm a successful test of
the lows. The next rally has the potential to be spectacular.
The difficulty with trying to come
up with any short-term forecast for the markets at this time (all the markets,
not just the stock market) is the high probability of events occurring
that could cause huge moves in either direction. For example, if the US-led
coalition begins its military assault and meets with some early success
then the major stock indices could add a quickfire 10%. By the same token,
another terrorist attack in the US would precipitate a sharp decline. All
we can reasonably do is trust our indicators and not bet the ranch on any
particular short-term view of the future.
This week's important economic/market
events
| Date |
Description |
| Thursday October 11 |
ECB Meeting
Import / Export Prices |
| Friday October 12 |
PPI
Retail Sales |
Gold and
the Dollar
Current Market Situation
From last week's Interim Update: "There
is still a chance that a pop in the gold price could occur in parallel
with the up-coming pullback in the stock market, but traders should be
quick to exit at the first sign of weakness." One sign of weakness
was identified as being a daily close below $290 in the December futures
contract. Another would be a break of the up-trend in the ratio of gold
stock prices to the bullion price.
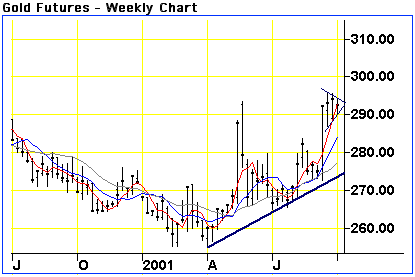
At this stage we haven't seen any sign
of weakness and have therefore not yet done any selling. December gold
did not close below $290 and last week was the second 'inside week' in
a row (the gold price traded within the range of the previous week). The
weekly chart (see below) illustrates the contracting trading range over
the past 3 weeks and can be likened to a spring that is progressively being
coiled more tightly. Unfortunately, the chart doesn't tell us which way
the price is going to break when the spring uncoils.

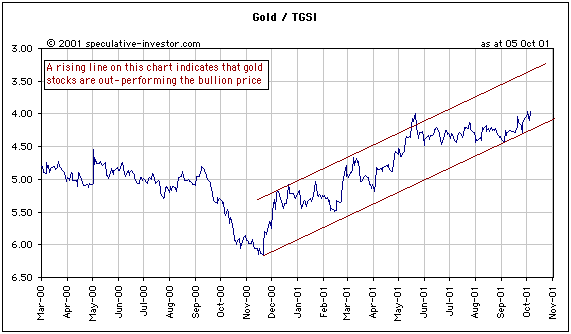
As the following chart shows, the ratio
of gold stocks (represented by the TSI Gold Stock Index - TGSI) to the
gold price remains within its up-trend. A short-term, and possibly a medium-term,
sell signal would be generated if the ratio breaks below this up-trend.
However, a major peak in the gold bull market is unlikely to occur until
the ratio moves to about 3:1.

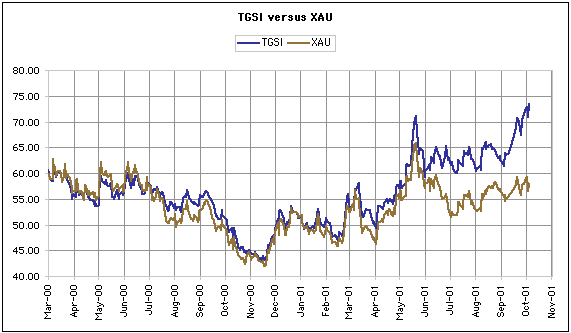
The reason we developed the TSI Gold
Stock Index was because the existing gold stock indices did not do a good
job of representing the performance of the world's major gold stocks. TGSI
comprises Barrick Gold, Placer Dome, Newmont Mining, Homestake, Anglogold,
Harmony Gold, Gold Fields, Normandy Mining, Lihir Gold and Franco Nevada,
with each stock given an equal weighting. Below is a chart comparing the
TGSI and the XAU since March 2000. Note that the two indices tracked each
other quite well until May of this year when a divergence began to develop.
Whereas the XAU is currently about 13% below its May peak, the TGSI has
moved to new highs for the year.

If the gold price is going to make
a final upward thrust before beginning a correction then the most likely
time for that to happen is in parallel with a pullback in the stock market.
Since a) there is some evidence that a stock market pullback has already
commenced, b) the weekly gold chart is poised for a breakout, c) the TGSI
is already surging, and d) the Australian and South African gold stocks
have recently begun to out-perform their North American counterparts (something
that tends to happen in the latter stages of a gold rally), the coming
week is a definite candidate for such a final thrust.
The Dollar Index continues to flag
higher within its downward-sloping channel (see the chart in last week's
IU), thus leaving the door open to a sharp near-term drop to around the
108 level. There is a good chance that this week's action in the currency
market will set the stage for the coming few months since it will now take
very little movement in either direction to create a breakout, one way
or the other.
Adding Liquidity
As evidenced by the behaviour of short-term
lease rates, central banks have practically been giving gold away to anyone
who wished to borrow it over the past 2 weeks. This is most likely being
done to create the illusion of financial market stability. Governments
and their bankers are doing their best to distort our view of the fundamentals,
but the fundamentals are what they are. A gold rally was stopped in its
tracks in 1999, but the fundamental backdrop is now very different.
In the short-term the price-fixers
might be successful, particularly if the military operations in Afghanistan
can achieve some initial success and thus give a temporary boost to confidence.
Beyond the next couple of months they cannot be successful because central
banks can create currency, but they can't determine how that currency is
used. The 165 billion dollars that was added to the total US money supply
during the week ended Sep-17 is sufficient to purchase about 13% of all
the gold ever mined in the history of the world. The $900 billion dollars
that have been added to the total US money supply over the past 12 months
are enough to purchase about 75% of all the gold mined in the history of
the world. If we also take into account the money created outside the US
then enough new fiat currency has been manufactured over the past year
to purchase all the gold ever mined. Unless central banks can either find
a way to convince investors throughout the world to ignore the massive
inflation that continues unabated or a way to create new physical gold
as quickly as they can add 'ones' and 'zeros' to the memory banks of computers,
they will be powerless to prevent a dramatic rise in the gold price. This
doesn't mean that we should stubbornly cling to our gold stock holdings
no matter what (our goal is to make money every year, not hold-out
for one magnificent pay-day at some undefined point in the future), but
we need to keep this big picture view in mind. The attempts of central
banks to keep a lid on the gold price will inevitably be swamped as a result
of their own profligate monetary policies.
Changes
to the TSI Portfolio
PD added at $27.30 with an initial
sell-stop set at $23.00.

|

