|
-- Weekly Market Update for the Week Commencing 10th March 2003
Forecast
Summary
 The
Latest Forecast Summary (no change from previous update) The
Latest Forecast Summary (no change from previous update)
Big Picture
View
Here is a summary of our big picture
view of the markets. Note that our short-term views may differ from our
big picture view.
Bond yields (long-term interest
rates) will move below their 2002 lows during the first half of 2003.
The US stock market will reach
a major bottom (well below the October-2002 low) during 2003.
The Dollar commenced a bear
market in July 2001 and will continue its decline during 2003.
A bull market in gold stocks
commenced in November 2000 and will continue during 2003.
Commodity prices, as represented
by the CRB Index, will rally during 2003 and 2004 with most of the upside
occurring in 2004.
TSI Vacation
Thanks for your patience over the past
2 weeks. We did send out one e-mail alert while we were away (on 3rd March
as forewarned in the 24th Feb Weekly Update), but fortunately nothing particularly
dramatic happened during our absence. The drama can start now.
War and
the Markets (Update)
The US and Britain want the UN to pass
a new resolution giving Iraq until 17th March to disarm or face military
action, but France, Russia and China have indicated they will veto such
a proposal. The permanent members of the UN Security Council therefore
remain divided over how to deal with Saddam Hussein.
The financial markets also appear to
be in several minds as to what is going to happen in the Middle East. For
example, the oil price has surged over the past few months, partly in anticipation
of a major supply shock relating to war in the Middle East. At the same
time, though, the stocks of US defense contractors - companies that stand
to benefit from a war - have fared poorly (the General Dynamics (GD) stock
price has fallen by 50% over the past 8 months and by 30% since the beginning
of this year). It could be argued that the stock market has factored in
a quick and decisive victory for the US, meaning that whatever benefit
the defense contractors were going to get from a war has already occurred,
but if this was really the case we would expect the US$ to be stronger
and the oil price to be weaker.
Our view is that there will be some
sort of resolution to the Iraq-related uncertainty before the end of this
month, but that this resolution will not alter any existing trends in the
financial markets. The primary trends for the S&P500 Index and the
US$ will still be down and the primary trends for gold and gold stocks
will still be up. There will almost certainly be a stock market rally in
response to the upcoming 'war resolution', regardless of what that resolution
happens to be, but if the rally begins from near current levels or higher
it will be short (a few weeks at best) and weak. If, however, the rally
begins from well below last October's low it will likely be powerful and
definitely worth participating in. The gold market's initial reaction to
a perceived resolution of the war uncertainty will probably be to take
the gold price sharply lower, but the negative reaction would likely be
short-lived (days, not weeks) and would create a wonderful buying opportunity
for anyone brave enough to fade the knee-jerk reaction of the herd.
Interest
Rates
We've got a few important things to
note with regard to the outlook for interest rates, but don't have the
time today to go into any details. So, here's the synopsis:
1. The Fed Funds Rate (the interest
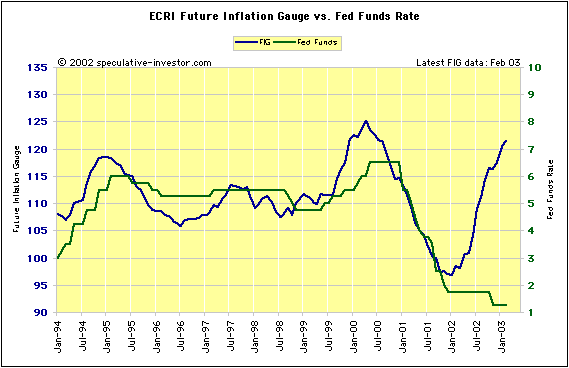
rate set by the Fed) has followed the ECRI's Future Inflation Gauge (FIG)
with great consistency over the past 15 years. At least, this was the case
until early-2002. However, over the past 12 months an enormous divergence
has developed between the Fed Funds Rate and the FIG (see chart below).
The last time the FIG was near current levels the Fed Funds Rate was at
5.5% (on its way to 6.5%).
2. The performance of the FIG suggests
that the Fed should now be aggressively hiking interest rates. However,
the yield on 3-month T-Bills - the short-term interest rate set by the
market - has just fallen to an all-time low of 1.10% (0.15% below
the Fed Funds Rate). The behaviour of the T-Bill yield suggests that the
Fed's next move will be to cut interest rates.
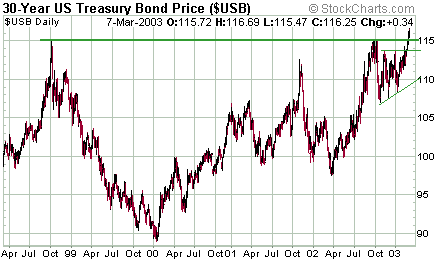
3. Last week, bond futures met our
expectation that new highs would be seen during the first half of this
year. Furthermore, if we had no information to go on apart from the below
chart we would now surmise that bond futures were headed for 120. Considering
the message of the FIG it is difficult to believe that bonds will move
substantially above their current lofty level, but we certainly wouldn't
be stepping in front of the bond train at this time.
4. Our forecast for new highs in bonds
during the first half of this year was almost solely based on our bearish
outlook for the stock market. This is because bonds have, for the past
few years, been trading more as anti-stocks than as the US Government debt
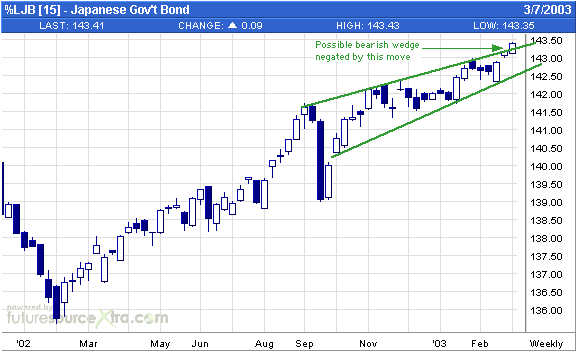
securities they really are. Our short-term bullish view on bonds was, however,
also supported by the on-going upward march of the Japanese bond market.
Japanese Government Bonds (JGBs) closed at new all-time highs at the end
of last week.
The US
Stock Market
Current Market Situation
Over the past few years bonds have
tended to reach extremes at around the same time that the stock market
has been reaching opposite extremes. For example, bonds bottomed in March
of 2002, within 2 weeks of the stock market reaching an important peak,
and then peaked in October-2002 on the same day the stock market bottomed.
So, the recent move to a new high by bond futures is probably warning us
of an impending drop to a new low by the stock market.
The bond market's message is consistent
with the on-going weakness in the US$ because the US$ is positively correlated
with the US stock market. Last week's break by the Dollar Index to a new
bear market low might therefore be a sign that the currency market is discounting
a drop to new lows by the stock market.
Technical and sentiment indicators
are presently 'mixed' and haven't altered significantly over the past week.
In fact, the following passage from the Market Alert e-mail sent to subscribers
on 3rd March is still applicable:
"...the past week's tedious drift
has helped work-off the 'oversold' condition that existed when we wrote
the 24th February Weekly Update. For example, the 10-day moving average
of the equity put/call ratio has fallen to 0.65, one of the lowest readings
of the past several months and only marginally higher than the levels reached
at the early-December and early-January market peaks. Also, after being
at a very oversold level of -170 only 3 weeks ago the McClellan Oscillator
closed last week at +70.
Markets never move in a straight
line for long and when a downward-trending market becomes extremely oversold,
as was the case with the US stock market in mid-late February, a rally
will often occur to alleviate the pressure. However, when an oversold extreme
leads to only a weak rally, as has also been the case with the US market
over the past 1-2 weeks, there is a good chance that the downtrend is still
in force. As such and although the major sentiment surveys still show moderate
levels of bearishness, with the oversold condition reflected in a number
of indicators having now been eliminated without the market making much
upward progress it is likely that the short-term downtrend is about to
resume."
In all likelihood the market will move
lower before a significant rally occurs. Also, our view remains that a
low will be in place by the end of March. Whether the rally following this
low will be worth trading aggressively or not will be determined, to the
greatest extent, by how far the market falls in the mean time.
World Markets
The Australian, French, German, UK
and Japanese stock markets are currently below last October's lows, while
the US, Canadian and Hong Kong markets remain above their October lows
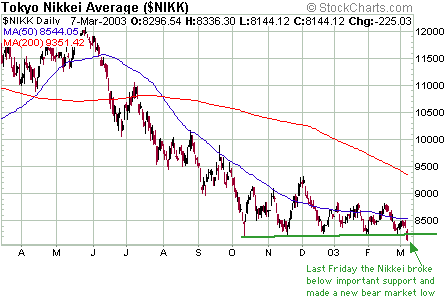
(by only 1.5% in the case of Hong Kong's Hang Seng Index). With its drop
to a new bear market low at the end of last week Japan's Nikkei225 Index
was the latest casualty.
What to do?
The stock market, since October of
last year, has been one of the most frustrating markets we've ever had
to deal with because there has been no follow-through in any direction
at any time. The market reached its closing low on 9th October of last
year and then embarked on what many commentators have, from time to time,
labeled a new bull market. However, all that really occurred following
the 9th October low was a sharp 4-day bounce. Subsequent to that 4-day
bounce most major stock indices have either drifted lower or traded sideways,
with no meaningful swings occurring in either direction. There is clearly
little buying interest in the market, no doubt as a result of unattractive
valuations, non-bullish price behaviour, concerns over the prospect of
war and the fact that the vast majority has remained heavily 'long' throughout
the entire bear market. There has also been minimal selling interest, seemingly
because retail investors have decided to 'ride out' the storm and professional
investors are too worried about the prospect of the much-discussed war
rally to 'short' the market with any real conviction. The end result: A
market that has been difficult to trade, particularly for those using options
in an attempt to profit from the expected 'swings'.
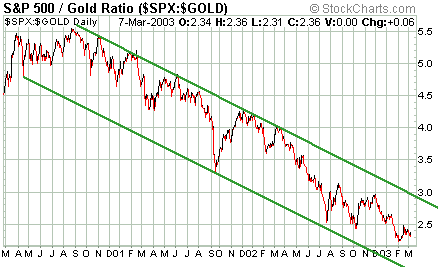
The below chart of the S&P500 Index
in terms of gold (the S&P500/gold ratio) does a good job of illustrating
the indecisive nature of the current market environment (indecisive, that
is, from a short-term perspective only because the longer-term outlook
could not be more decisive). A low-risk trading opportunity would occur
if the S&P/gold ratio moved to either the top or the bottom of the
major channel shown on this chart. Unfortunately, the ratio is currently
near the mid-point of its channel.
We have done very little in the market
over the past several months because we haven't been able to identify trades
with attractive risk/reward ratios. We have suggested a few option trades
and managed to exit a Dow put-option trade with substantial profits. At
the same time, though, we have seen the prices of our QQQ put options get
whittled down by the market's tedious grind, despite the fact that the
QQQ is lower now than it was when the put options were added to the Stocks
List. Also, we recently suggested that traders take an initial position
in Alcoa (NYSE: AA) and expect to add to this position, as well as purchase
a few other commodity-oriented stocks, during any general market shake-out
over the next few weeks. The problem is, the market is resisting all attempts
to take it significantly lower and without some sort of selling climax
we will not be presented with a good buying opportunity (we doubt that
any rally beginning from above last October's lows will add more than 10%-15%
to the major indices). If we don't get a genuine selling climax it will
come down to the question of whether or not it is worth buying just for
the sake of gaining some exposure to the rally that might occur
once the war-related uncertainty is temporarily removed. The answer to
this question is a qualified no. We say "qualified" because even if the
risk/reward in the overall market is unattractive as far as new buying
is concerned there may be good opportunities to buy individual stocks or
to use call options to gain some exposure to the potential upside without
putting much money at risk.
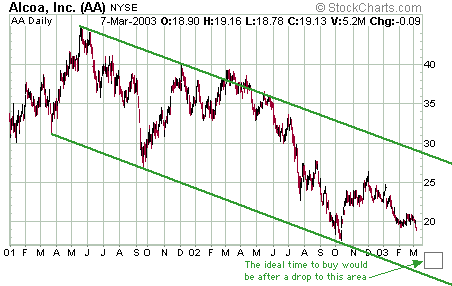
We've identified Alcoa as a reasonable
buy near its current level and have noted that its risk/reward ratio would
improve substantially if it dropped to near the bottom of its major channel
(see chart below). As such, we've added an initial position in AA and plan
to buy more if it drops to the $14-$15 area. Note that it would also be
reasonable to do some buying near the October low (around $18). The reason
for 'scaling in' during weakness, rather than simply waiting for a plunge
below $15 before doing any buying, is that the risk/reward is acceptable
at current levels from both valuation and technical perspectives and the
price might not drop to major support before the next significant rally
occurs.
Other potential long-side speculations
over the next month or so, depending on market action, include copper producer
Phelps Dodge (NYSE: PD) and chip-maker Micron Technology (NYSE: MU). From
a fundamental perspective Micron has very little going for it, but it is
a stock that should rally sharply if the overall market temporarily recovers
(especially if it first spikes down to a new bear-market low below $6.60).
The tedious grind of the past few months
will end soon with the market following-through to either the upside or
the downside. As discussed above we think there will be some downside follow-though
(a move to new lows for the year), followed by a rally, with the size of
the rally being determined mostly by how far the market falls over the
next few weeks.
One point worth reiterating at this
time is that the market is destined to move MUCH lower than current levels
before the bear market ends. In fact, we expect the major US stock indices
to trade 30%-50% below their current levels at some stage during the coming
18 months. What this means is that longer-term investors should not be
considering any buying at this time. The buying opportunity that will potentially
emerge over the next few weeks will not be 'investment grade' because valuations
are still way too high. At best, it will just be another trading opportunity.
This week's important economic/market
events
| Date |
Description |
| Monday March 10 |
No significant events |
| Tuesday March 11 |
No significant events |
| Wednesday March 12 |
Trade Balance |
| Thursday March 13 |
Retail Sales
Import / Export Prices |
| Friday March 14 |
Current Account for Q4 2002
PPI
Industrial Production |
 Click
here to read the rest of today's commentary Click
here to read the rest of today's commentary

|

