|
-- for the Week Commencing 10th June 2002
Forecast
Summary
 The
Latest Forecast Summary (no change from last week) The
Latest Forecast Summary (no change from last week)
Big Picture
View
Here is a summary of our big picture
view of the markets. Note that our short-term views may differ from our
big picture view.
Bond yields (long-term interest
rates) will move higher during 2002.
The US stock market will make
new bear market lows in 2002.
The Dollar commenced a bear
market in July 2001 and will continue its decline into 2003.
A bull market in gold stocks
commenced in November 2000 and is likely to extend into 2003.
Commodity prices, as represented
by the CRB Index, will rally during 2002 and 2003.
The oil price will resume its
major uptrend during the first half of 2002.
The US
Stock Market
One Third of the Dow
We are going to take a quick look at
the charts of 10 stocks that are part of the Dow Industrials Index
to see what messages, if any, the markets are sending. The charts are provided
here courtesy of www.decisionpoint.com, an excellent resource for anyone
interested in technical analysis and stock market indicators.
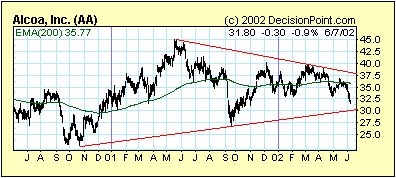
1. Aluminium producer Alcoa bottomed
in October of 2000. Since May of 2001 the stock has been making lower highs
and higher lows and is currently neither bullish nor bearish.
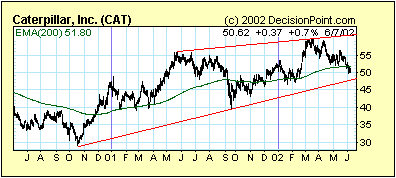
2. Heavy equipment manufacturer Caterpillar
has been trending higher since bottoming in October of 2000. CAT has continued
to make higher highs and higher lows and can therefore be considered bullish
from a medium-term perspective.
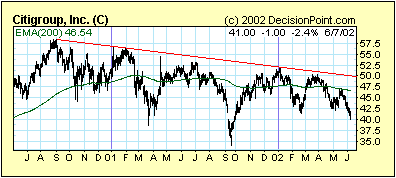
3. Citigroup has been trending lower
since September of 2000 and appears to have substantial downside risk.
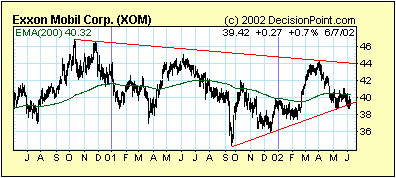
4. Exxon Mobil has made a series of
lower highs since peaking in October of 2000. It has trended higher since
last September but is presently in danger of breaking that trend.
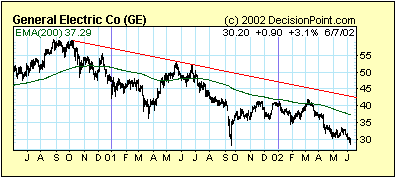
5. General Electric, the world's largest
company in terms of market cap, has a decidedly bearish chart. If support
at the September-2001 low gives way, as it is likely to over the coming
months, then a drop to the 1998 low (near $23) would be in the cards.
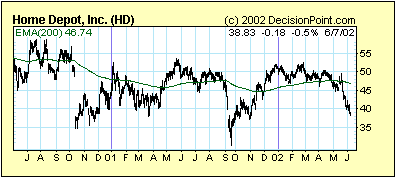
6. The retailers rebounded strongly
following last September's plunge, but in Home Depot's case the rally failed
to exceed the May-2001 peak. HD's chart is bearish and a drop below the
September-2001 low appears likely.
7. International Paper has been in
a steady up-trend since bottoming in October of 2000.

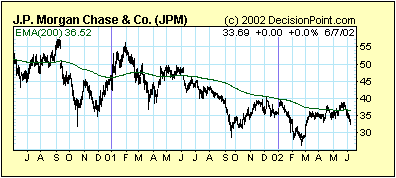
8. JP Morgan Chase has made a series
of lower highs and lower lows since peaking in September of 2000. This
chart is decidedly bearish and a break below the 2001 low appears inevitable.
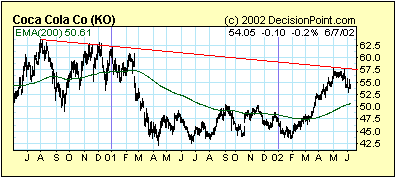
9. Coca Cola is a company that benefits
from a weakening US$ so it is not surprising that KO reversed sharply higher
in January at the same time as the Dollar embarked on its downtrend.
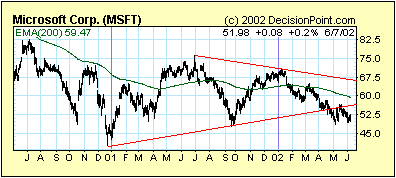
10. Microsoft is a stock on which we
recommended buying put options 2 months ago when it was trading in the
high-50s. The chart is similar to Alcoa's except that it has broken below
the bottom of its contracting triangle, thus signaling that the next big
move will be down. A rebound to around $55 would present another good opportunity
to buy put options on this stock.
The following themes are apparent from
looking at the Dow stocks. Firstly, the strongest stocks are those that
benefit directly from higher inflation and/or a weaker US$. Secondly, the
weakest stocks are the ones that would be most adversely affected by higher
interest rates. The banks clearly fall into this category as does GE due
to its huge finance business and its massive debt. Thirdly, the cyclical
stocks - the stocks of the companies that are sensitive to changes in economic
growth - tended to bottom way back in October of 2000. This makes no sense
considering that the US economy supposedly plunged into recession in March
of last year. One possible explanation (the one we favour) is that the
NBER (the National Bureau of Economic Research) goofed when it declared
a recession last year. Our view is that the recession lies in the future.
How far in the future? At this stage we think next year is a likely candidate,
but our view could change depending on the performance of leading indicators.
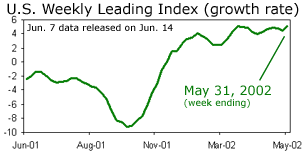
With the ECRI's Weekly Leading Index having just hit a 17-month high (see
chart below), a recession this year is extremely unlikely.
Current Market Situation
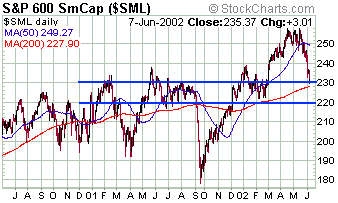
Strength in small cap stocks has, over
the past year, been a major element of the bullish case. The S&P600
(an index of small cap stocks) reached an all-time high during the first
half of May before dropping sharply over the past few weeks. At this stage
it is possible to argue that the recent 10% decline in the S&P600 was
simply a pullback within an on-going bull market since important support
was not breached.
Below is a decisionpoint.com chart
showing the NASDAQ100 Index (NDX) and the NASDAQ100 Volatility Index (VXN).
The VXN normally moves in the opposite direction to the NDX, but the scale
on the VXN chart has been reversed so they appear to be moving in the same
direction. Volatility is a sentiment indicator - it tends to rise when
traders become more fearful and falls when they become more complacent.
As such, volatility usually reaches a peak near important bottoms and troughs
when the market is near a peak. The interesting thing at the moment is
that while the NDX is within spitting distance of last September's low
the VXN is where it was prior to start of last September's
plunge.
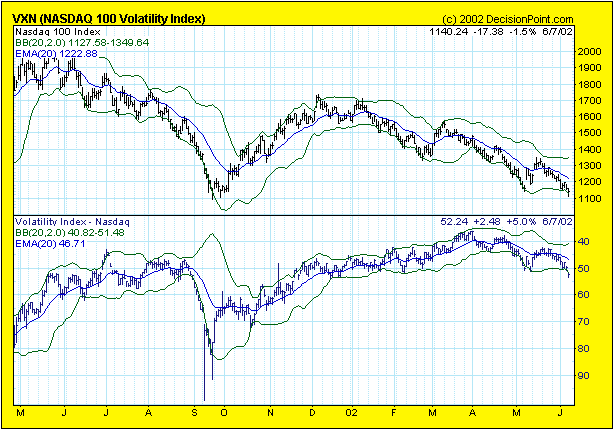
What we are seeing in the current NDX-VXN
relationship is consistent with what we would expect to see if the NDX
was about to break down to a major new low. It is not what we would expect
to see if the NDX was about to complete a successful test of its September-2001
low. The only question is, do we get a 1-2 week 'pause to refresh' before
the plunge or do we plunge right away?
We've recently been anticipating a
short respite prior to the next major decline and continue to do so even
though the market seems incapable of rallying for more than a few hours.
We just get the impression that selling pressure has been temporarily exhausted
and that in the absence of terrible news (such as we got from Intel late
last week) the market will stabilise for a while. We already have MSFT
and Dow put options in the TSI Portfolio and will look for an opportunity
to add a position in JPM put options.
Commodities
John Gross, publisher of the Copper
Journal newsletter, earlier this week made the following comments regarding
copper:
"Technically, I believe it's overbought.
The market has not been driven by any kind of turn in demand. The fundamentals
overall are still weak, as evidenced by BHP's production cutback, and I'm
inclined to view this [the recent rally] as an overreaction."
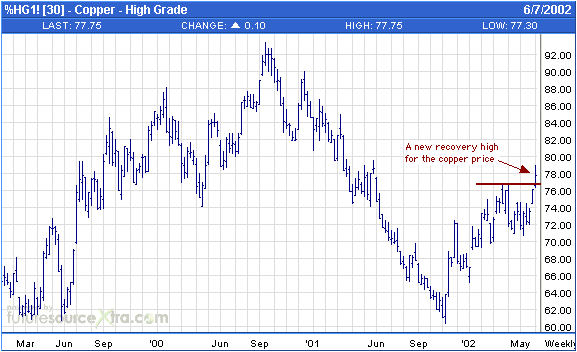
Below is a weekly chart of copper futures.
We don't have any particular view on the short-term direction of the copper
price although last week's breakout to a 12-month high was certainly a
positive technical development. Taking a 6-12 month view we are extremely
bullish on copper. A much higher copper price will be a natural result
of the massive inflation of the past 18 months and a considerably weaker
US$.
Below is a chart showing the zinc price
since 1998. Whereas copper's price action over the past 8 months has been
bullish, the zinc market is yet to show any signs of life. We expect this
to change and are bullish on zinc taking a 12-month view.

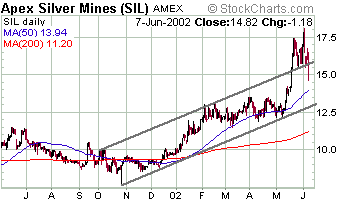
We currently have exposure to zinc
via Apex Silver (AMEX: SIL). Apex's development-stage San Cristobal project
is one of the world's best mining assets. It contains a high-quality reserve
of 470M ounces of silver and 8.8 billion pounds of zinc, meaning that each
Apex share gives an investor exposure to 14 ounces of silver and 255 pounds
of zinc. That is the sort of leverage we want in a commodity stock! The
Apex stock price under-performed the pure-play silver stocks during the
recent rally in gold and silver shares, but Apex's leverage to the zinc
price will eventually become a positive (we expect the base metals to out-perform
the precious metals next year). In the mean time, Apex offers good relative
value at its current price even if we assume zero value for its enormous
zinc reserves. From a technical perspective the recent sharp pullback has
simply brought the stock back into its previous upward-sloping channel.
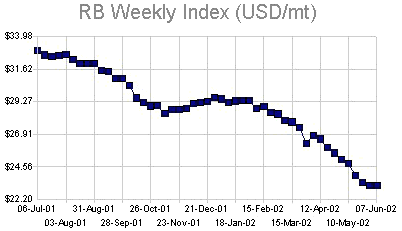
The coal price has performed poorly
over the past 8 months both in absolute terms and relative to the price-performances
of the other 'energies' (oil, natural gas). Below is a chart showing an
index of coal prices over the past 12 months (source: www.globalcoal.com).
Since prices within the energy complex will tend to move together due to
substitution (when one form of energy becomes expensive the major users
will substitute another form), we think that coal currently presents an
interesting opportunity. We have exposure to the coal price via MIM Holdings
(ASX: MIM) and BHP Billiton (ASX: BHP).
Below is a weekly chart of crude oil
futures. Over the past month the July contract has fallen by almost $4
and is probably close to a low, although further substantial weakness in
the stock market would be a short-term negative for oil. July crude closed
at $24.75 on Friday and should find support somewhere between $22 (the
breakout area from earlier this year) and $23.20 (the 200-day moving-average).

This week's important economic/market
events
| Date |
Description |
| Monday June 10 |
No significant events |
| Tuesday June 11 |
No significant events |
| Wednesday June 12 |
Fed Beige Book
Import / Export Prices |
| Thursday June 13 |
PPI
Retail Sales |
| Friday June 14 |
Industrial Production |
 Click
here to read the rest of today's commentary Click
here to read the rest of today's commentary

|

