|
-- Weekly Market Update for the Week Commencing 12th May 2003
Forecast
Summary
 The
Latest Forecast Summary (no change from previous update) The
Latest Forecast Summary (no change from previous update)
Big Picture
View
Here is a summary of our big picture
view of the markets. Note that our short-term views may differ from our
big picture view.
Bond yields (long-term interest
rates) will continue to move in the same direction as the stock market,
that is, new lows in bond yields (new highs in bond prices) will occur
before the end of 2003.
The US stock market will move
well below the October-2002 low during 2003, but a major bottom won't occur
until 2004.
The Dollar commenced a bear
market in July 2001 and will continue its decline during 2003 and 2004.
A bull market in gold stocks
commenced in November 2000 and will continue during 2003 and 2004.
Commodity prices, as represented
by the CRB Index, will rally during 2003 and 2004 with most of the upside
occurring in 2004.
An "unwelcome
fall in inflation"
The statement issued by the Fed following
last week's monetary policy meeting included this gem:
"...the Committee perceives that
over the next few quarters the upside and downside risks to the attainment
of sustainable growth are roughly equal. In contrast, over the same period,
the probability of an unwelcome substantial fall in inflation, though minor,
exceeds that of a pickup in inflation from its already low level."
When the Fed talks about inflation
it doesn't mean inflation in the correct sense (an increase in the money
supply), it is referring to rising prices for goods and services. Therefore,
Greenspan and Co. appear to be worried about a substantial fall in prices.
The question is, why? After all, computer prices fall substantially every
year, yet no one complains about being able to buy better computers for
less money and the computer industry hasn't collapsed. Why wouldn't it
be good, rather than bad, if prices throughout the economy mimicked computer
prices and fell every year?
As a result of on-going productivity
improvements the natural long-term price trend for most goods is down.
This trend is blatantly obvious in the computer industry because the gains
in productivity over the past two decades have been spectacular, but it
is also applicable in most other industries. The reason that prices actually
spend most of their time rising, rather than falling, is because credit
growth is typically a lot faster than productivity growth. Therefore, what
the Fed is really worried about isn't falling prices, it is slower credit
growth (high credit growth is what prevents prices from trending lower).
In our 23rd April commentary under
the heading "War Cycles and Peace Cycles" we explained why slower credit
growth could be such a huge problem. In a nutshell, under the current monetary
system almost all new money comes into existence as the result of a loan.
Every newly-created dollar therefore brings with it a liability in excess
of one dollar due to the obligation to pay interest, and this, in turn,
means that the total of all obligations to pay money will be greater than
the total supply of money. Furthermore, the more money that is borrowed
into existence the greater will be the gap between the total supply of
money and the total of all obligations to pay money. Obviously, all attempts
to keep the system afloat by facilitating faster credit growth will only
provide momentary relief while creating an even bigger problem for the
future. Momentary relief is, however, the overriding goal of current Federal
Reserve policy.
Interestingly, after trending lower
for much of the past 16 months the rate of credit growth has recently begun
to move away from what the inflation merchants at the Fed would probably
consider to be the danger zone. As evidence, note the definite up-tick
in the year-over-year M2 growth rate illustrated on the below chart. Based
on US Government and Federal Reserve actions and statements over the past
two years, we suspect that a year-over-year M2 growth rate of 6% is now
considered to be dangerously low. That is, the money supply must now expand
at the rate of at least 6% per year to allow most existing debts to be
serviced. The M2 growth rate had fallen to 6.4% in early January this year,
but thanks to massive government borrowing to finance the war in Iraq and
to the lowest interest rates in many decades, momentary relief has been
accomplished.
The US
Stock Market
Making up reasons
When prices move substantially higher
or lower in any market, fundamental reasons are always concocted by analysts
and commentators to explain the price action. However, while these reasons
satisfy the need for an explanation they often bear little resemblance
to what is really happening. For example, every time tech stocks have experienced
good-sized rallies over the past few years lots of stories have started
appearing in the press about the imminent recovery in tech spending. In
this respect the current rally is no exception, but as was the case in
2001 and 2002 the current talk of a recovery is simply a knee-jerk reaction
to what is happening in the stock market. The below extract from the latest
Goldman Sachs' IT spending survey (Goldman surveys the people responsible
for setting information technology budgets at large corporations) illuminates
the point that the current rally is NOT based on reasonable expectations
for increased tech spending during the second half of this year.
"Our latest IT spending survey,
taken in mid-April, suggests that spending continues to contract,
on the margin. Contrary to the stabilization we expected from our first
postwar survey, average 2003 spending intentions dropped to minus 3% from
plus 1% in February. Perhaps most troubling, those expecting spending
acceleration in the second half of the year virtually evaporated, pushing
their expectations into 2004 or after 2004. "
[Emphasis ours]
Convictionless bears
Although there is a lot of evidence
that the average retail trader is very bullish, a lot of hedge funds are
still trying to position themselves on the 'short side' every time the
market approaches what looks like a short-term peak. This is making it
difficult for the market to go down with any conviction because these 'hedgies'
are, by nature, quite low on conviction. In other words, they are quick
to reverse course if the market doesn't 'act' right.
As mentioned in last week's Interim
Update, we are likely to see a pullback over the next 2 weeks (actually,
a pullback probably began last Wednesday with Friday's rally creating a
test of Tuesday's peak). However, at least one more new high might be needed
following this pullback in order to convert a few more convictionless bears
before a large decline gets underway. In any case, we won't be getting
excited about the potential for a large decline until we see signs that
investors have once again started to become more risk averse. As previously
advised, one of the easiest ways to monitor the level of risk aversion
in the market is via the NASDAQ100/Dow ratio.
Current Market Situation
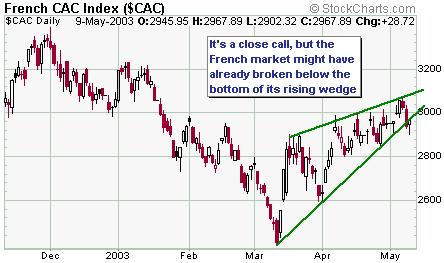
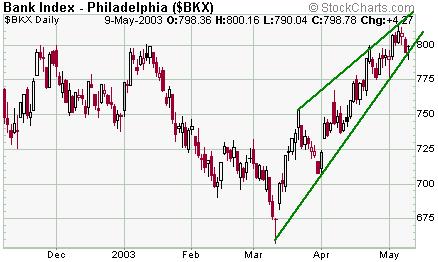
Many of the major stock indices are
still potentially forming bearish 'rising wedge' patterns (three
examples shown below). This potential, though, won't be realised until
or unless the indices close below the bottoms of their wedges before they
close above the tops.
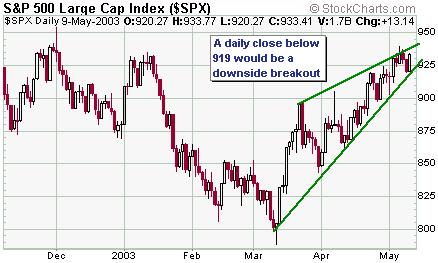
Although the S&P500 made a lower
high on Friday (Friday's peak was below Tuesday's peak), the Volatility
Index (VIX) plunged to a new low for the year on Friday. This continues
the divergence between sentiment and price action that has been so readily
apparent over the past month (traders have become far more bullish than
the price action warrants).
This week's important economic/market
events
| Date |
Description |
| Monday May 12 |
No significant events |
| Tuesday May 13 |
Trade Balance |
| Wednesday May 14 |
Retail Sales
Import / Export Prices |
| Thursday May 15 |
Industrial Production
PPI |
| Friday May 16 |
CPI
New Residential Construction |
Click
here to read the rest of today's commentary

|
