|
-- for the Week Commencing 12th November 2001
Forecast
Summary
 The
Latest Forecast Summary (no change from last week) The
Latest Forecast Summary (no change from last week)
Big Picture
View
Here is a summary of our big picture
view of the markets. Note that our short-term views may differ from our
big picture view.
Bond yields (long-term interest
rates) will move higher into 2002.
The US stock market will rally
into the first quarter of 2002, but will subsequently make new bear market
lows.
The Dollar will head lower into
2002.
A bull market in gold stocks
commenced in November 2000 and is likely to extend into 2002.
Commodity prices, as represented
by the CRB Index, are in the process of bottoming. The CRB Index will reverse
higher by the first quarter of 2002 (at the latest) and then rally over
the ensuing 1-2 years.
The oil price will resume its
major uptrend during the first half of 2002.
Commodities
Update
Copper
Think back to late-1998/early-1999
when the oil price was wallowing just above $10. At that time the consensus
view was that the world was awash in oil and that the excess supply would
ensure a low oil price for a long time to come. Even when OPEC began to
cut production during the first quarter of 1999 very few analysts thought
these cuts would have much of an effect. Within the next 2 years the oil
price tripled.
Now consider the current situation
in the copper market. The consensus view is that the world has an enormous
over-supply of copper that will ensure a low copper price for a long time
to come. Phelps Dodge recently announced a production cut of 222,000 tonnes
per year and last week BHP Billiton announced a production cut of 170,000
tonnes per year, but these cuts are perceived as having little effect.
Is there any reason to expect a surge in the copper price over the next
2 years of similar magnitude to the 1999-2000 oil price rally, or is the
consensus view correct this time?
While the OPEC production cuts no doubt
helped boost the oil price in 1999, our view is that the bulk of the 1999-2000
rally in the oil price resulted from an increase in demand that, in turn,
resulted from excess financing (money supply growth). The massive increase
in the money supply during 1998 and 1999 was guaranteed to have an effect
on prices with the only question being which prices. For a number
of reasons, including the fact that the very low oil price over the preceding
few years had removed incentives to invest in oil production and to cut-down
on oil consumption, the oil price was a major beneficiary of the inflation
of 1998 and 1999. The stark similarity between early-1999 and now is that
we are in the midst of an enormous monetary expansion and we have the price
of one of the world's most indispensible resources (copper) sitting near
multi-decade lows. In 12 months time the major copper producers will be
rushing to bring more production on-line as the copper price skyrockets
in response to an apparent under-supply of the metal.
As we've explained in the past, buying
the stocks of commodity producers after the underlying commodity
prices have shown definitive signs of strength usually doesn't work particularly
well. This is because the stocks rally in anticipation of a rise
in the commodity prices, not in response to such a rise. We'll use the
following charts of the copper price and copper producer Phelps Dodge (PD)
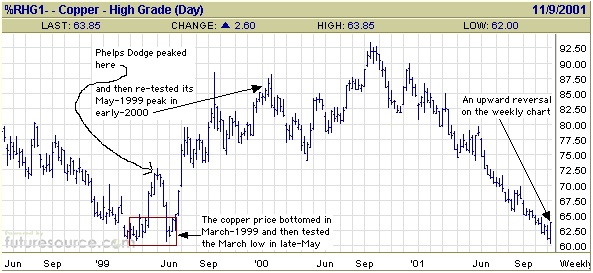
to illustrate this point. Note that in 1999 the copper price made a major
bottom in mid-March, had a bounce of about 20% into early-May, and then
dropped to re-test its March bottom in late-May. PD, however, began to
rally in early-February and by the time the copper price was making its
initial rebound peak in early-May PD had rallied by 70% from its low. Despite
the fact that the copper price continued to rally throughout 1999 PD was
never able to move decisively above its May-1999 peak (it made a marginal
new high in early-2000 that is not shown on the below chart).
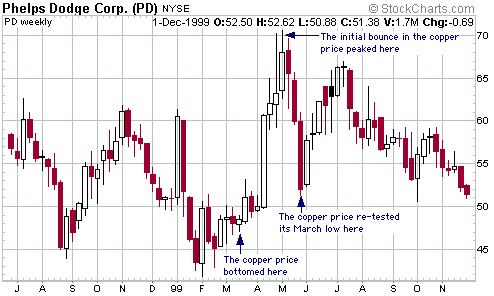
Two more points on the subject of copper.
Firstly, last Wednesday's low in the copper price was roughly equivalent
to the 1999 low, but PD traded at around $27 last Wednesday versus a low
of $41 in 1999 (PD represents better value now than it did in 1999). Secondly,
the copper price experienced what looks like a significant upside reversal
last week - it hit its lowest level since 1987 before recovering to close
the week above the highs of the preceding two weeks.
Oil
The oil price was very strong late
last week on the back of threatened supply cuts from OPEC and Russia. The
sharp rebound from around $19.50 earlier in the week to Friday's close
of around $22 indicates that we have probably seen the bottom for oil this
year. However, as explained in the Oct-17 Interim Update oil at $22 may
be cheap in terms of the over-valued US$, but it is still expensive in
terms of most other commodities. The ratio of the CRB Index to the oil
price would need to rise to around 11:1 to bring the oil price into line
with commodity prices in general. A CRB Index of 190 therefore implies
a reasonable price for oil of around $17. So, unless there is an enormous
rally in commodity prices over the next several months it is unlikely that
we have seen THE bottom of the cyclical bear market in oil that began in
late-2000.
Our decision to add an oil stock (OXY
- Occidental Petroleum) to the TSI Portfolio last Friday was only partly
based on expectations for a near-term oil price recovery (when we sent
the e-mail recommending the purchase of OXY the news that Russia was going
to support OPEC's production cuts had not been released and the oil price
was only up 13c). Our major reasons were: a) the AMEX Oil Index had remained
within its 3-year uptrend throughout the general stock market panic, and
b) oil stocks are likely to be bid-up as the stock market continues to
discount next year's economic recovery.
General
We do not think that commodity prices
are ready to commence a major rally, but a rally into year-end followed
by a test of the lows during the first quarter of next year is a distinct
possibility. Since Sep-26 we've been recommending that investors begin
building positions in the stocks of some of the major commodity producers
and we continue to believe that this is a sensible approach.
There is
no inflation?
From the Oct-01 WMU: "At the moment
the inflation is in the pipeline, but the future effects of the
inflation are only apparent to those who can, and want to, see. With the
economic news being generally quite lousy and likely to get even worse
as a result of the terrorist attacks, with the effects of the inflation
not being evident in any of the popular price indices and unlikely to become
evident over the next few months, and with the drop in energy prices
likely to further suppress the obvious signs of inflation in the near-term,
there will be no pressure on the Fed to deviate from their inflation policy.
In actual fact, there will probably be a lot of pressure on the Fed to
step even more firmly on the monetary gas pedal."
The drop in energy prices caused the
Producer Price Index to plunge 1.6% in October, thus ensuring that a) there
are very few of us thinking about the growing inflation problem and b)
the Fed has carte blanche to expand the money supply and cut interest rates.
The US
Stock Market
Current Market Situation
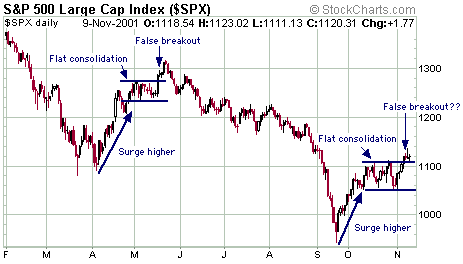
Below is a chart of the S&P500
Index highlighting the eerie similarities between the rally since the Sep-21
panic low and the rally that occurred during April and May. If the similarities
persist then the market will gradually roll over and drop to a new low.
We do not think the similarities will
persist, primarily due to the enormous difference between the current sentiment
of market participants and the sentiment that prevailed in May. In particular,
we've been amazed at the heavy put-option buying that has occurred in the
QQQ (a popular trading vehicle that tracks the NASDAQ100) over the past
few weeks. The QQQ's average put/call ratio over the past 2 weeks has been
much higher than it was during the weeks leading up to the panic lows of
April and September, despite the NASDAQ's obvious recent strength. This
means that option traders, as a group, do not believe that the rally off
the September lows has any staying power (these same people were aggressively
buying call options in May). The similarities in the charts between the
current rally and the April/May rally is probably also contributing to
the skepticism.
There appears to be an expectation
in the air that something is going to go horribly wrong and many traders
are positioning themselves accordingly. We are told that the commentators
and guests on CNBC are waxing as bullish as ever (we don't know this from
first hand experience since we never watch CNBC), but based on the eagerness
of traders to bet against the market the CNBC message is clearly not getting
through.
There are certainly a lot of legitimate
worries at this time. Most of the industrialised world is involved in the
bombing of Afghanistan, there is the distinct possibility of more terrorist
attacks on the US, there are rumours floating around that bin Laden has
obtained nuclear weapons, and there is the on-going deluge of terrible
economic news. All of this is known and therefore factored into the market,
but things can always get worse. However, what happens if things don't
get worse? What happens if they get better with so many traders expecting
the worst?
The next rally has the potential to
be very strong, but despite the generally-bullish sentiment picture we
do not think it is wise to leap into the market at this time. We've added
a few commodity producers to the Portfolio since the September bottom and
these stocks will give us reasonable long-side exposure if the market decides
to rocket higher without first stopping to re-fuel (the commodity producers
we've recommended also appear to have minimal downside risk). However,
we still expect a pullback before the next major advance gets underway
(unfortunately, the pullback is almost certainly not going to be quick
enough or deep enough to add any significant value to our November QQQ
put options). Five reasons for not throwing caution to the wind at this
time are:
a) Although traders have been betting
heavily against the NASDAQ100 Index, they have been betting heavily in
favour of some of the major components of the index (Cisco is an example).
b) The rally of the past few weeks
has been led by some of the most over-priced stocks (Cisco, once again,
is an example). This is not 1999 and those who pay 8-times revenue for
a loss-making company are unlikely to be rewarded beyond the very short-term.
c) Although option traders have demonstrated
disbelief in the NASDAQ's rally, two of the more reliable sentiment surveys
(the Market Vane and Consensus-inc surveys) show that bullish percentages
are approaching levels that have, in the past, coincided with short-term
peaks.
d) The debt market has not yet begun
to discount an economic recovery. This is something that will probably
change over the next few weeks, but until it does (until short-term interest
rates begin to move higher) we have to be a little suspicious of any stock
market rally.
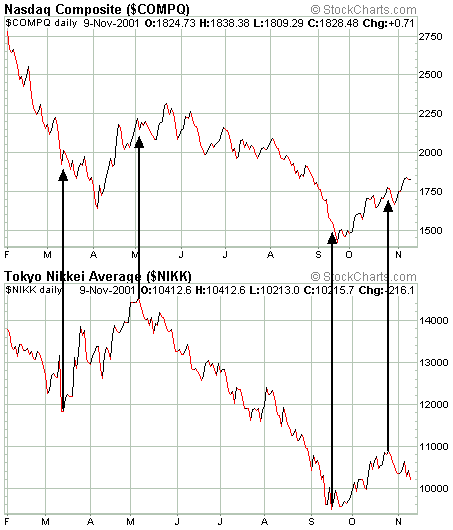
e) The Japanese stock market has been
leading the US market by 1-3 weeks for most of this year and the Nikkei
has already experienced a significant pullback (see chart below).
The most bullish thing the market could
do would be to pullback sharply over the coming week, thus building on
the doubts that already exist and setting the stage for a subsequent strong
advance into year-end. If, instead, the market continues higher over the
coming week then a longer pullback would likely ensue thereafter.
This week's important economic/market
events
| Date |
Description |
| Monday November 12 |
US bond market closed for Veterans'
Day holiday |
| Wednesday November 14 |
Retail Sales |
| Friday November 16 |
CPI
Industrial Production / Capacity Utilisation |
Gold and
the Dollar
The Commitments of Traders (COT)
Report
Our impression is that many gold analysts
misinterpret the COT Report because they always consider the traders' commitments
to be bullish for gold when the commercial traders are net-long and bearish
for gold when the commercial traders are net-short. The thinking is that
the commercials have the best handle on the supply/demand situation in
the market and will therefore tend to be right most of the time.
This might sound reasonable, but it
is not supported by the historical data. For example, the commercials were
net-short throughout most of 1993, 1994 and 1995, a period during which
the gold price remained quite firm. Furthermore, the commercials were almost
continuously net-long from early-1997 until September 1999, a period during
which the gold price declined relentlessly. The commercials were also net-long
throughout much of last year as the gold price declined. However, they
have been mostly net-short since the gold price began trending higher in
April of this year.
The fact is that the commercials are
usually wrong. This actually makes some intuitive sense to us because
a) the fundamentals lag the financial markets (traders in the futures markets
are acting today based on what they think the fundamentals are going to
be tomorrow), and b) speculators usually try to position themselves in
line with the price trend, so in any market where there is a definite price
trend (gold was most definitely trending lower between 1997 and 1999) the
speculators are probably going to be right. The commercials are, however,
invariably right at those times when the trend is about to change.
Speculators have been heavily net-long
gold futures and commercials have been heavily net-short for the past couple
of months. As discussed above this is not in itself bearish since the specs
are usually on the right side of the market. However, if the specs are
heavily net-long and a correction commences, the correction is unlikely
to end until the speculative net-long position has been mostly eliminated.
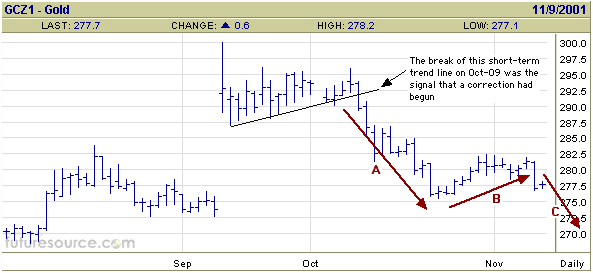
When the gold price broke below its
short-term uptrend on Oct-09 it signaled that a correction was commencing.
This correction will continue until the speculators are either flat or
net-short (the latest COT Report showed that large speculators were net-long
13,500 contracts and small traders were net-long 22,000 contracts). It
is most likely going to require a drop below $275 before that will happen.
Gold - the Big Picture
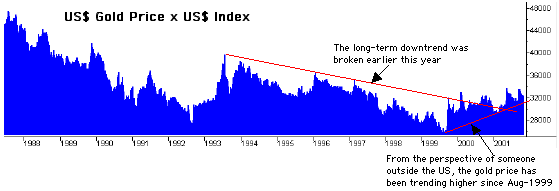
From the point of view of someone outside
the US, gold's long-term bear market has ended. The following chart was
provided by Nick Laird (http://www.sharelynx.net/Markets/Charts.htm)
and shows the US$ gold price multiplied by the US$ Index. It therefore
illustrates the average performance of the gold price in terms of the currencies
of the US' major trading partners.
Gold - the Small Picture
After the gold price broke below its
short-term uptrend on Oct-09 we speculated that the ensuing correction
would occur in 3 waves (an A-Wave decline to the initial low followed by
a B-Wave rebound followed by a C-Wave decline to the final low). The below
chart shows that the C-Wave decline probably began last Thursday. As noted
above, the odds are in favour of gold's correction continuing until the
speculative net-long position has been eliminated. This is likely to take
2-3 more weeks, after which the market might do the right thing and present
us with another low-risk opportunity to buy short-term trading positions
in gold stocks. In the mean time we are retaining a core investment position
in several high-quality gold stocks.
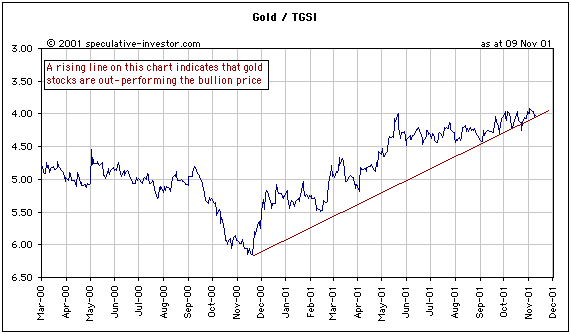
The ratio of gold stock prices (represented
by the TSI Gold Stock Index) to the bullion price is still trending higher,
although it is currently in the process of testing its uptrend for the
fifth time since early-September.
The Dollar
It was a quiet week in the currency
market. There was very little movement in either the Dollar or the euro,
although the Yen provided a few tentative signs of strength. The Yen's
current situation is quite interesting since it's recent price action has
been mildly bullish while the COT Report shows that speculators are betting
heavily against it. This potentially creates a set-up for a powerful Yen
rally fueled by short-covering speculators (when a market begins trending
higher at a time when most speculators are short the speculators must reverse
their position in a hurry to put themselves in synch with the new trend).
At the same time the Japanese central bank and Ministry of Finance are
desperately trying to weaken the Yen. So, a tug-o-war seems to be developing
here - Ms Market is starting to pull the Yen higher and the BOJ is saying
"not so fast".
We continue to be very bearish on the
Dollar, but are unsure if another sharp decline will occur this year or
be postponed until next year. We had hoped that the market would have tipped
its hand by now, but short-term technical indicators remain unclear.
Changes
to the TSI Portfolio
OXY and BHP were added to the Portfolio
as per Market Alert #60.

|

