|
-- for the Week Commencing 13th May 2002
Forecast
Summary
 The
Latest Forecast Summary (no change from last week) The
Latest Forecast Summary (no change from last week)
Big Picture
View
Here is a summary of our big picture
view of the markets. Note that our short-term views may differ from our
big picture view.
Bond yields (long-term interest
rates) will move higher during 2002.
The US stock market will make
new bear market lows in 2002.
The Dollar commenced a bear
market in July 2001 and will continue its decline into 2003.
A bull market in gold stocks
commenced in November 2000 and is likely to extend into 2003.
Commodity prices, as represented
by the CRB Index, will rally during 2002 and 2003.
The oil price will resume its
major uptrend during the first half of 2002.
Oil Update
Strength in the oil price from mid-January
to around mid-March could be put down to monetary and economic factors.
It occurred in parallel with a rising CRB Index, strength in cyclical stocks
and a generally weak bond market, that is, it was consistent with the behaviour
of other markets (all the markets appeared to be responding to expectations
for higher inflation and economic growth). However, over the past 2 months
the CRB Index and the stock market have pulled back and bond prices have
risen, and yet the oil price closed at a new high for the year at the end
of last week. The below chart illustrates the recent divergence between
the oil price and the CRB Index.
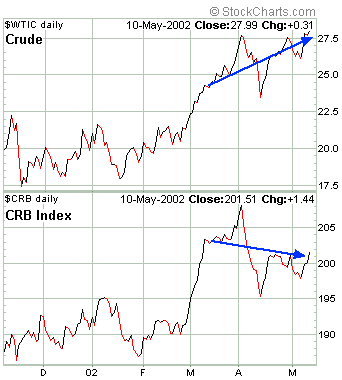
The oil price has clearly been responding
to something other than economic or monetary forces over the past 2 months,
and that 'something' is almost certainly the situation in the Middle East.
Our guess is that there is currently a $3-$5 premium in the oil price specifically
related to an expected further escalation of conflict in the Middle East.
The implications of this are that:
a) If the market perceives that relative
stability is temporarily returning to the Middle East then the oil price
would likely experience a sharp correction
b) If the current speculative premium
in the oil price represents an accurate assessment of risk then the Middle
East is closer to breaking-out into all-out war than most people think
The war premium that is currently in
the oil price can also be seen by looking at the spreads between the different
crude oil futures contracts. Oil futures are usually in 'backwardation',
meaning that the longer the time to expiry the cheaper the price. In other
words, August crude would usually be slightly cheaper than June crude.
For example, on the 11th of March the June crude futures contract on NYMEX
closed at 24.73 and the August contract closed at 24.60, so the spread
was 0.13. At the close of trading last Friday the spread between these
two contracts had blown-out to $1.08, that is, June crude is currently
4% more expensive than August crude. There appears to be a sense of urgency
in the oil market.
In inflation-adjusted dollars a $30
oil price ($2 above Friday's close) is not high, particularly in an enviroment
in which the US$'s foreign exchange value is falling. As such it is unlikely
that a rise in the oil price to $30 would create a serious problem for
the US economy. A $30 oil price is high, however, in terms of most other
commodity prices simply because most commodities are phenomenally cheap.
We therefore expect the oil price to fall sharply once (perhaps we should
say if) some semblance of stability returns to the ME. This will be necessary
in order to bring the oil price into line with other commodity prices.
The US
Stock Market
Japan versus the US
Daily news reports tell us that the
economic situation in Japan is dismal, not just in absolute terms but also
in relation to the economic situation in the US. The news reports might
be accurate, but as investors we are far more interested in how things
are going to look in 6-12 months time than in how they look today. Interestingly,
the performances of the stock and currency markets suggest that the economic
situation in Japan is going to be much better in 6-12 months time than
it is today, both in absolute terms and relative to the US.
As mentioned over the past few weeks,
one of the things that the US stock market has going for it at this time
is the relatively good performance being put in by the Japanese stock market.
However, although turning points in the US market still appear to be following
turning points in the Japanese market as has been the case since the beginning
of last year, about 3 months ago large-cap stocks in the US began to dramatically
under-perform their Japanese counterparts.
Below is an updated version of the
Nikkei225-NASDAQ100 chart comparison that we've shown many times in the
past. A few weeks ago the Nikkei appeared to break upwards out of a short-term
downtrend, but it has actually just entered a wider channel. The Nikkei's
short-term trend is still down, but unlike the US market's bearish price
action the March-May decline in the Japanese market has the appearance
of a counter-trend move within an emerging bull market.
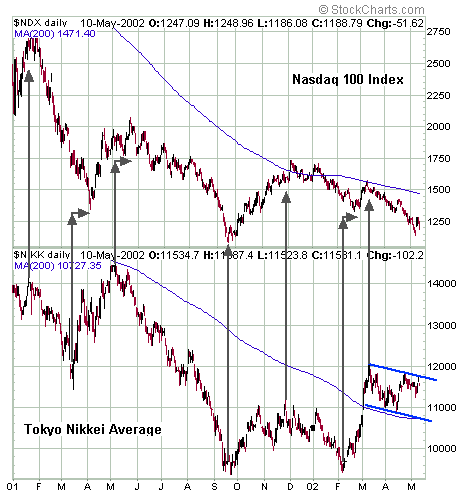
The Nikkei will have to achieve a daily
close above its early-March peak (12,034) before we will be confident that
the next upward leg in its bull market has begun.
The Dow in terms of Gold
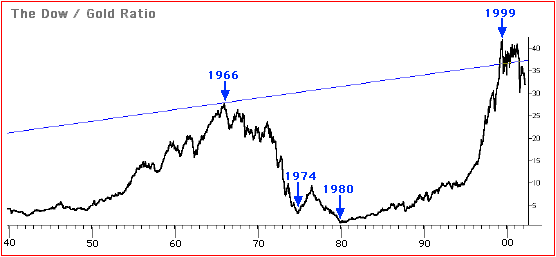
Lest anyone get the idea that the Dow
is close to a major bottom and the gold price is close to a major peak,
below is a long-term chart of the Dow/gold ratio. Looking at the big picture
we can see that the Dow, in terms of gold, is still very close to the secular
peak reached in 1999. Note that the previous secular peak was reached
in 1966, following which the Dow trended lower for 14 years relative to
gold. In a world where the US$ loses its purchasing power at a rapid rate
a substantial decline in the Dow/gold ratio will tend to come about more
from a rising gold price than from a falling Dow.
The timing of a major stock market
bottom
Below is a chart comparing the Dow
Industrials (1929-1932), the Japanese Nikkei225 (1989-1992), and the NASDAQ
Composite (2000-2003). The chart for each index begins at the day of the
major peak and extends for exactly 3 years.
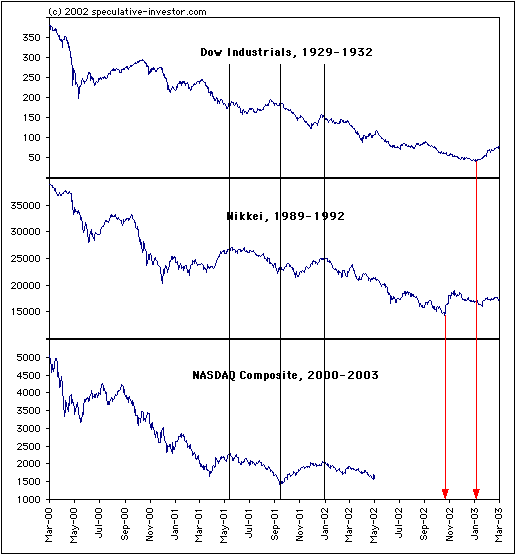
If the duration of the NASDAQ's decline
from its major peak to its long-term bottom roughly matches that of the
other two major post-bubble declines of the past hundred years then the
NASDAQ will reach a long-term bottom between October-2002 and January-2003.
Since the NASDAQ has, to date, followed a similar pattern to the previous
post-bubble declines and since the one constant in the financial markets
throughout the ages is human emotion, it is not unreasonable to expect
the NASDAQ to bottom roughly in line with the 1930s Dow and the 1990s Nikkei.
There is no reason to expect that every
twist and turn on the NASDAQ chart will match the twists and turns on either
the Dow or Nikkei charts, although over the past 12 months the NASDAQ has
been following a path that closely matches that of the Nikkei at the same
stage of its decline. In any case, the message we get from both historical
charts is that a) the NASDAQ is likely to fall 30%-60% from its present
level between now and its ultimate bottom, and b) the absolute maximum
gain that we should expect during any bear market rally over the next several
months is 30% (10%-20% is more likely).
Current Market Situation
Following Wednesday's ferocious rally
we wrote (in the Interim Update): "There are two things we should see
at the end of this week if this rally has some staying power. Firstly,
the June S&P500 futures will close the week above 1073 as mentioned
above. Secondly, the COT Report released on Friday will show a significant
reduction in the commercial net-short position." The June S&P500
futures closed the week at 1054 and the latest COT Report showed an insignificant
6000 contract reduction in the Commercial net-short position. So, at this
stage there is no evidence that last Wednesday's surge was the start of
something meaningful. Other negatives at this time are:
a) The decline during the final 2 days
of last week did not result in significant increases in volatility or put/call
ratios
b) Middle East tensions continue to
percolate (as evidenced by oil price strength)
c) Large traders are still heavily
net-long T-Note futures (since bonds and stocks are moving in opposite
directions the smart-money's bullishness on T-Notes compliments, and confirms,
their bearish outlook for the stock market).
The good news is:
a) By closing near its low for the
year at the end of last week the June S&P500 has another good chance
to achieve an important reversal this week. It simply needs to spike below
1045.80 at some point during the coming week and close the week above 1054.10.
b) Although the major stock indices
closed the week above last Tuesday's lows there is now almost universal
belief that Wednesday's upward reversal was a 'one-day wonder'. This means
that a lot of traders could once again be caught leaning the wrong way
as was the case last Wednesday.
In the 8th May Interim Update we said
we'd wait and see how the market finished the week before making any further
suggestions. Since the market has failed to provide any evidence whatsoever
that last Wednesday's upward reversal was the start of a tradable rally
there is no reason for us to suggest any additional long-side trading positions.
However, our commodity-cyclical stocks continue to hold up well and investors
who wish to increase their exposure to this sector should consider pullbacks
in stocks such as CHK and BHP as buying opportunities. The QQQ call options
suggested during last week's WMU are, at best, a 50/50 proposition. They
are worth holding if you already have them.
We have no intention of adding to our
medium-term bearish position during the current weakness (the TSI Portfolio
contains long-dated put options on MSFT and the Dow), but would be interested
in adding to this position if the market does manage to put together a
decent rebound at some stage. It is also worth noting that gold stocks
have been trading like S&P500 put options over the past 8 months and
should continue to perform well in the event that a multi-week rebound
in the overall stock market does not materialise.
This week's important economic/market
events
| Date |
Description |
| Monday May 13 |
No significant events |
| Tuesday May 14 |
Retail Sales |
| Wednesday May 15 |
Consumer Price Index
Industrial Production |
| Thursday May 16 |
Residential Construction |
| Friday May 17 |
Trade Balance |
Gold and
the Dollar
Gold versus Silver
In our 6th May commentary we said that
our expectation has been, and still is, that gold would out-perform silver
"until the general level of commodity prices, as represented by the
CRB Index, began a major up-trend. Being as much an industrial commodity
as it is a form of money silver tends to do better than gold during those
periods when commodity prices are trending higher." This comment sounds
quite logical (even if we do say so ourselves) and, strangely enough, is
supported by what has actually happened over the past 30 years.
Below is a long-term chart comparison
of the silver/gold ratio and the CRB Index. Note the general tendency for
the two to trend in the same direction over extended periods, indicating
that silver does usually out-perform gold when the general level of commodity
prices is in a long-term up-trend.

There are, in fact, two times when
silver tends to out-perform gold - when commodity prices are trending higher
or when the stock market is in a multi-year up-trend. Strength in silver
relative to gold was a characteristic of the period from 1991 through to
1999, an era of considerable stock market strength. It also occurred during
the cyclical stock bull market of 1975-1976 and during the 1982-1983 stock
market rally.
Further to the above, gold will probably
continue to out-perform silver until either a) the CRB Index provides some
technical evidence that it has commenced a major up-trend, or b)
the stock market reaches a long-term bottom. As noted earlier in today's
commentary, a likely time for a major stock market bottom to occur is during
the period from October-2002 to January-2003.
Even if silver performs poorly relative
to gold for the remainder of this year it is still likely to do well in
absolute terms. There is little chance that the gold price will move sharply
higher without the silver price also experiencing a sizeable gain. Furthermore,
if silver under-performs gold it does not necessarily follow that the stocks
of silver mining companies will under-perform the stocks of gold mining
companies. As stated in the 1st May Interim Update: "The gold stock
universe is tiny compared to the overall stock market or even compared
to many individual corporations, but it is enormous compared to the silver
stock universe. As such, once the silver price finally breaks above the
brick wall of resistance at $4.80 the silver stocks will fly." The
combined market capitalisation of all the word's silver producing/exploring
companies is so small that even a small amount of interest from the investment/trading
herd could produce massive gains in the prices of silver stocks.
Due to silver's lethargic price action
over the past several months most silver stocks currently do not have as
much of a speculative premium built into their prices as do most gold stocks.
As such, they will probably hold up better than gold stocks during the
next correction. They are also likely to make large catch-up moves at some
point.
Corner Bay Silver (BAY.TO) remains
our favourite silver stock. It is effectively a core investment (it is
one of the stocks with which we plan to ride-out the bull market), although
it won't officially be a core investment until the feasibility study on
its Alamo Dorado Project has been completed. We also have a trading position
in Silver Standard (NASDAQ: SSRI), a company that owns a large silver resource
but, unlike BAY, needs a silver price of at least $6 before its resources
will become economic. And, we are now going to add one more silver mining
company to the Portfolio as a core investment. That company is Apex Silver
(AMEX: SIL).
Apex has a number of interesting exploration-stage
projects and one development-stage project. We'll ignore Apex's exploration
potential for now and just focus on the project that is currently under
development (the San Cristobal Project) since it, alone, makes Apex a worthwhile
investment at the current share price.
The San Cristobal Project in Bolivia
contains a silver/zinc deposit with current proven and probable reserves
of 470 million ounces of silver and 8.8 billion pounds of zinc (US$5.4B
of metal at today's low prices for Ag and Zn). It is expected to produce
27M ounces of silver and 570M pounds of zinc per year during its first
5 years of operation, thus generating annual revenue of US$335M assuming
today's low commodity prices. During this first 5 years of production the
cash operating costs are expected to be $1.23/oz for silver (net of lead
by-product) and $0.23/lb for zinc. It is estimated that life of mine cash
costs will be $1.83/oz for silver and $0.27/oz for zinc. At Friday's closing
price of US$13.30 per share Apex has a market cap of US$465M.
Apex's disadvantage, in the short-term,
is that about 60% of the revenue from the San Cristobal project will come
from the production of zinc. However, over the longer-term this makes Apex
an interesting commodity-cyclical play as well as an interesting precious
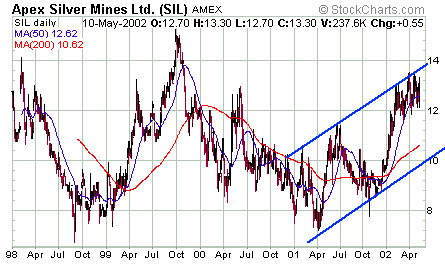
metals play. The Apex stock price is presently near the top of its trading
channel (see chart below) so now is not an ideal time to buy from a technical
perspective, but the fundamentals are compelling and there are no guarantees
that a better opportunity will present itself in the future. In our view
a reasonable approach would be to take a position now with the aim of adding
to the position during any significant pullback over the next few months.
Current Market Situation
From the 8th May Interim Update: "The
bottom line is that while we think gold stocks are close to at least a
short-term peak we haven't yet seen anything in the price action to confirm
that a peak has been reached. In other words, the short-term trend is still
up. We will hold onto our few remaining gold stock trading positions for
now. We have not even considered reducing our core investment position
in gold stocks."
The above quote still applies. In fact,
two of our core gold-stock investments - Harmony Gold and Gold Fields Ltd
- closed at new all-time highs on Friday, confirming that the short-term
trend is most definitely still up.
In a nutshell, our views are that a)
gold and gold stocks are in a bull market that will last at least until
the end of this year and quite possibly until the end of this decade, and
b) although the short-term trend is still up many gold stocks are sporting
large speculative premiums that make new purchases at this time quite risky.
Ideally, all of our readers will already have a sizeable investment position
in gold stocks and will therefore not feel the need to buy into the current
frothy market. In reality, however, this will not be the case, particularly
for those who have joined us over the past few months. So, what should
someone do if they don't already have a large exposure to gold stocks?
Firstly, they can buy physical gold
and silver. The upside potential is not as great with the physical metal
as it is with the mining stocks, but neither is the downside potential.
Secondly, they can buy the stocks of silver producers as discussed above.
Although silver has been lagging gold we expect it to play 'catch-up' at
some stage, thus sending silver stocks into orbit. Thirdly, they can buy
the stocks of small exploration-stage companies that are yet to benefit
from the speculative fever. We recently added one such stock to the TSI
Portfolio (Northern Dynasty) and will probably add one or two more over
the next few weeks.
Acknowledgement
The Dow/Gold and Silver/Gold ratio
charts included in today's commentary are modified versions of charts available
at Nick Laird's (Sharefin's) excellent web site: http://www.cairns.net.au/~sharefin/Markets/Master.htm
Update
on Stock Selections
Apex Silver (AMEX: SIL) added as discussed
above.

|

