|
-- for the Week Commencing 15th October 2001
Forecast
Summary
 The
Latest Forecast Summary The
Latest Forecast Summary
Big Picture
View
Here is a summary of our big picture
view of the markets. Note that our short-term views may differ from our
big picture view.
Bond yields (long-term interest
rates) will move higher into 2002.
The US stock market is in the
process of making a major bear market bottom.
The Dollar will head lower into
2002.
A bull market in gold stocks
commenced in November 2000 and is likely to extend into 2002.
Commodity prices, as represented
by the CRB Index, are in the process of bottoming. The CRB Index will reverse
higher by the first quarter of 2002 (at the latest) and then rally over
the ensuing 1-2 years.
The oil price will resume its
major uptrend by January 2002.
Fiscal
Stimulus
Even though it is a tactic that has
been tried many times in the past and has never worked, the US Government
seems intent on increasing its spending in an attempt to stimulate the
economy. The fiscal stimulus package is likely to be around $100B, with
the only disagreement between Republicans and Democrats being how the money
will be spent.
In a letter to the Wall St Journal
last week Milton Friedman points out that extra government stimulus doesn't
actually stimulate the economy because government spending simply replaces
private spending, and private spending is almost always more productive
than government spending. While we agree with Friedman's conclusion - that
extra government fiscal stimulus will not make any meaningful contribution
to economic growth - we do not agree with his reasoning. If the Fed monetises
any additional government spending (if the additional government debt resulting
from the stimulus is purchased by the Fed with newly-printed dollars),
something that is apt to happen, then the extra government spending will
not replace private spending. In this case it will, however, be inflationary
and will put upward pressure on long-term market interest rates and thus
cannot possibly have any long-term beneficial effect.
While railing against the proposed
$100B of additional fiscal stimulus, Friedman brushes aside the $900B of
monetary stimulus that has occurred over the past year. Our view is that
the fiscal stimulus will be inflationary because it will be monetised by
the Fed, but it is almost inconsequential when measured against
the increase in the money supply that has already occurred. The
past year's massive money supply growth is going to have a huge effect
on prices over the next two years with, we think, commodity prices being
the major beneficiaries. It is not going to result in real growth, although
the reported growth in real GDP will look healthier due to the way the
inflation rate is understated in these official reports.
Whenever the economy runs into a rough
patch politicians always seem to feel the need to do something,
regardless of the fact that history clearly shows that the more a government
tries to manage the economy the worse it gets. If the current bunch can't
find it in themselves to stand aside and do nothing, let them make way
for those who can!
The US
Stock Market
Current Market Situation
Let's do a quick review.
1. When the market was hitting its
lows in September the level of fear, as measured by a number of reliable
sentiment indicators, reached an extreme that has only ever occurred near
major bottoms.
2. In our Sep-17 and Sep-24 commentaries
we said that a substantial reduction in the commercial net-short position
in S&P500 futures would be expected to occur if a major bottom
was in the process of forming. This has occurred (the latest Commitments
of Traders Report shows that the commercial net-short position has fallen
to 39,000 contracts, down from 83,000 contracts just 4 weeks ago).
3. We've mentioned on several occasions
that the Japanese stock market has been leading the US stock market for
much of this year and that an upturn in the Nikkei would therefore likely
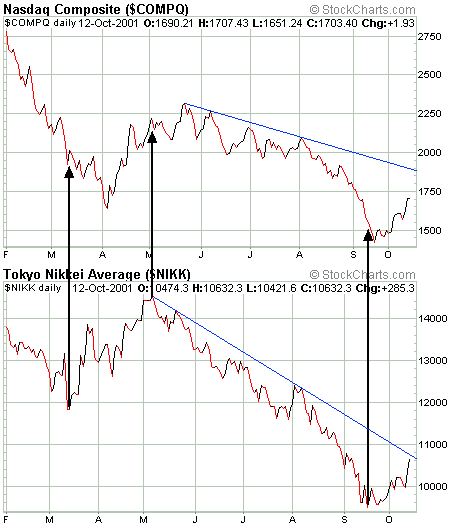
precede a sustainable upturn in the US market. As the following
charts illustrate, the recent upward reversal in the NASDAQ Composite was
preceded by an upward reversal in the Nikkei. Note, however, that neither
index has yet moved above the downtrend that began in May, so there is
not yet any technical evidence that the upturns in either market are anything
more than oversold bounces.
4. The monetary environment, which
has been positive throughout this year, became phenomenally bullish in
the wake of the Sep-11 terrorist attacks due to the provision, by the Fed
and the private banks, of a veritable flood of new credit. This flood of
new credit will be very supportive for the stock market over the next few
months, although the longer-term effects will not be bullish because interest
rates will inevitably be pushed higher to account for the Dollar depreciation
that will result from the increased Dollar supply.
5. Valuation levels for many of the
large-cap stocks may still be too high, although the price-earnings ratios
of cyclical stocks do tend to be very high near the bottom of the cycle
due to plunges in earnings.
6. If the panic sell-off that culminated
on Sep-21 did create a long-term bottom, a test of the Sep-21 lows would
still be likely at some point over the ensuing 6 weeks.
So far we've seen the initial bounce
off the lows and now expect to see a test of the lows. While we expect
the test to be successful (the coming pullback should see the major indices
find support above the panic lows of Sep-21), we were not prepared to ride-out
this decline and therefore sold our QQQ shares (purchased on Sep-25) last
Friday. Last week saw massive short-covering and some spectacular gains
in many tech stocks, but there were signs at the end of last week that
the rally had almost run its course. If all goes according to plan over
the next 1-2 weeks and we see some evidence that a successful test of the
lows has occurred or is in the process of occurring (the behaviour of sentiment
indicators and market internals will give us important clues in this respect),
then we will do some buying to position ourselves for what should be a
powerful rally thereafter.
This week's important economic/market
events
| Date |
Description |
| Tuesday October 16 |
Industrial Production / Capacity Utilisation
Intel Earnings (after the close) |
| Wednesday October 17 |
AOL Earnings (after the close) |
| Friday October 19 |
Trade Balance
CPI |
Gold and
the Dollar
The Traders' Commitments - an indicator
of sentiment
It is usually better to gauge sentiment
in any market based on what people are doing with their money rather
than what they are saying. As far as the commodity and currency
futures markets are concerned, the Commitments of Traders (COT) Report
can provide a good indication of the prevailing sentiment.
The large speculators in the futures
markets tend to be right most of the time, but are invariably wrong at
important turning points. This is because they position themselves in line
with the existing price trend and will generally stay with the trend until
there is a change. When the speculators build up a large net-long position
it demonstrates a high level of confidence in the existing up-trend, that
is, it means that the prevailing sentiment in the market is extremely bullish.
Similarly, when they are substantially net-short it demonstrates a high
level of confidence that the price will continue to decline, that is, it
means that sentiment is extremely bearish. However, short-term trend changes,
or at least shake-outs, often occur after the majority becomes convinced
that an existing trend is going to remain in place.
As the speculative net-long
position in a market grows, thus pointing to increasingly-bullish sentiment,
the commercial net-short position will correspondingly increase.
The commercial traders tend to be more value-oriented than the speculators
and will often sell as the price rises and buy as the price drops. Also,
trades undertaken by the commercials in the futures markets are often done
for the purpose of hedging a position in the underlying physical market
(to lock-in a profit or limit the risk of loss).
The latest COT Report showed that speculators
had built-up a large net-long position in gold futures and commercial traders
had accumulated a large net-short position. The commercial net-short position
was around 65,000 contracts as at Oct-09 (the date of the latest report),
although it is reasonable to assume that the commercials would have covered
some of their 'shorts' when the price fell sharply on Wednesday and Thursday.
The large speculative net-long and commercial net-short positions in gold
futures were signs that sentiment had become too exuberant and that the
risk of a correction was high. However, they do not suggest that we have
just seen anything more than a short-term peak in the gold price. If the
last gold bull market (1993) is anything to go by, a major top will not
occur until the commercials are net-short to the tune of at least 120,000
contracts.
Based on past experience, now that
a correction has commenced it is not likely to end until the commercial
net-short position has fallen below 20,000 contracts. This is probably
going to take at least a few weeks to transpire, particularly if we get
an intervening rebound in the gold price that prematurely entices speculators
back to the long-side.
As far as currency futures are concerned,
the commitments for the European currencies (the euro and the SF) are very
bearish (most speculators were positioned for a continuation of the SF/euro
rally) whereas the commitments for the C$ and the A$ are bullish. We therefore
expect to see the A$ and the C$ out-perform the European currencies over
the next few weeks. This is consistent with our view that the general trend
in commodity prices will turn higher during the next few months (the A$
and the C$ - the commodity currencies - tend to move in advance of commodity
prices).
The footprints of big government
With speculators in gold futures having
positioned themselves for a rally, it is not strange that last Tuesday's
rally failure led to a swift decline. What is strange is that the
preceding build-up of speculative long positions combined with increased
demand for physical gold did not result in a much larger rally in
the first place. The bullish fundamentals combined with motivated long-side
speculation should have been good for at least a $100 rally in the gold
price, as opposed to the $25 rally that actually transpired.
The reason for gold's inability to
move higher than it did should be obvious to anyone who watches the gold
market closely and objectively. We noted on two occasions over the past
few weeks that the low and falling gold lease rates were a clear sign that
central banks had been aggressively supplying physical gold to the market,
almost certainly with the goal of capping the gold price and thus creating
the illusion of stability.
The efforts of central banks to keep
a lid on the gold price will eventually fail because each price-capping
attempt requires that additional physical gold be supplied to the
market. This is important - a physical supply deficit cannot be filled
using paper claims to gold. Unfortunately for the banks the supply of physical
gold is severely limited and, relative to the supply of fiat currency,
is becoming less every day. There is persuasive evidence that 10,000-15,000
tonnes of official gold reserves, or between one-third and one-half of
the total gold reserves of the world's central banks, have already been
unofficially dumped on the market via loans and swaps. Most of this
gold has been surreptitiously supplied to the market over the past decade,
but the volume required to effect the on-going price-suppression has jumped
over the past 2 years.
With investment demand already increasing
and looking set to surge over the coming year as the effects of this year's
massive Dollar inflation start to become evident, the CBs are simply not
going to have enough physical gold to continue their price-capping operation.
In the mean time, government manipulation of the gold market is another
variable that we must consider when constructing our forecasts. As much
as we detest the way that governments regularly interfere in supposedly
free markets in order to achieve short-sighted political gains, we must
trade based on the way things are not the way they should be.
Current Market Situation
With sentiment in the gold market having
become very optimistic and with speculators in gold futures having piled
on to the long-side, any technical failure had the potential to cause a
large sell-off (this is why we exited trading positions following Tuesday's
trendline break and had previously identified $290 as a stop-out point).
However, this sell-off does not disrupt our medium-term bullish view on
gold. In fact, declines in bull markets tend to be sharp and usually end
as soon as a healthy level of skepticism emerges.
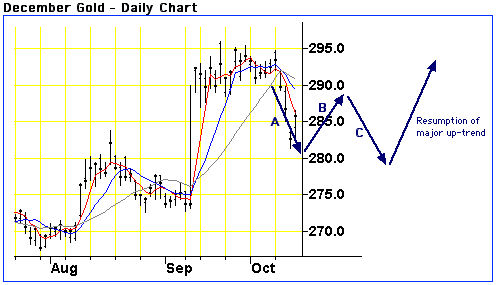
As far as how this correction in the
gold market will unfold, we suspect something along the lines of an A-B-C
decline with the 'A' (the initial decline) perhaps having ended last Thursday.
The following chart illustrates what we mean.
We have no preconceived ideas regarding
how long this correction will last. Instead, we will monitor the COT report,
various ratios (such as the ratio of the TSI Gold Stock Index to the bullion
price), the behaviour of inter-related markets (eg, currencies and interest
rates), and the behaviour of gold and gold stock prices as they approach
support levels, with the goal of identifying another low-risk buying opportunity
(for traders). In the mean time we are maintaining our core investment
position in gold stocks.
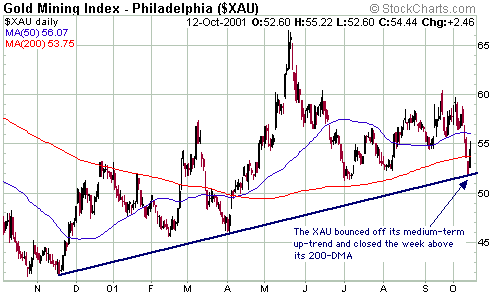
Here's what the charts are saying.
Firstly, last week the XAU bounced exactly where it needed to bounce in
order to keep the medium-term up-trend in tact. Also, last Thursday several
gold stocks (eg, FN, AEM, NEM, DROOY and HGMCY) dropped to near the initial
support levels identified in last week's Interim Update before rebounding
strongly.
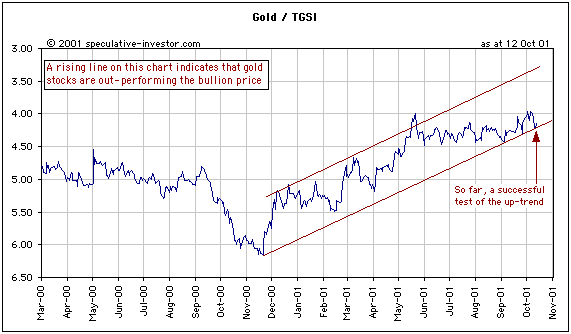
Secondly, the ratio of the TSI Gold
Stock Index (TGSI) to the bullion price remains in an up-trend.
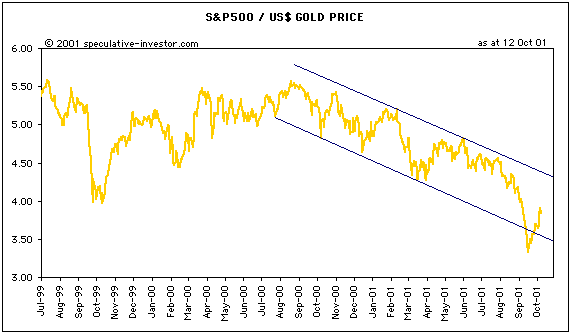
Thirdly, the S&P500/gold ratio
(the number of ounces of gold it takes to buy the S&P500 Index) has
been trending lower within a well-defined channel since August 2000, but
the reactions of the markets to the events of Sep-11 caused the ratio to
spike below the bottom of its channel. The action of the past 2 weeks has
brought the ratio back toward the middle of the channel and the next rally
in the stock market will probably move the ratio back to near the top of
the channel (with gold at 285 a return to the channel top would require
the S&P500 to rally to around 1200).
Fourthly, the Dollar Index broke out
of its downward-sloping channel last week. The Dollar is overbought and
for the coming 1-2 weeks is probably going to lose the tailwind that has
recently been provided by a rising stock market, so the risk of a breakout
failure is significant. However, if the Dollar can pullback over the next
week without re-entering its downtrend then an extended Dollar rebound
is likely.

Financial markets remain extremely
unsettled, to say the least. Acts of terrorism and the US response to these
acts have naturally taken centre-stage, but most of the financial problems
that existed prior to Sep-11 are still festering. For example, the Argentine
debt crisis has been pushed off the front pages by the dramatic events
of the past month, but it continues in the background and may be worsening.
Last week Moody's cut Argentina's credit rating to the lowest of any country,
thus highlighting the distinct possibility that Argentina will default
on its $132B of foreign debt. The US$ would probably move lower (relative,
at least, to the Swiss Franc) in advance of any Latin American financial
'blow-up', so excessive weakness in the Dollar versus the SF should be
considered as an early warning sign of trouble ahead (especially since
a rally in the SF at this time would be counter to the SF's bearish traders'
commitments).
Summary
Assuming no 'bolts from the blue',
such as a further escalation of Argentina's debt crisis, the next 1-2 weeks
are likely to see some strength in gold and gold stocks (the 'B-wave' rebound),
and pullbacks in the Dollar and the US stock market (both to higher lows).
Changes
to the TSI Portfolio
QQQ sold on Oct-12 for a gain of about
20%.

|

