|
-- for the Week Commencing 16th July 2001
Forecast
Summary
 The
Latest Forecast Summary (no change from last week) The
Latest Forecast Summary (no change from last week)
Big Picture
View
Here is a summary of our big picture
view of the markets. Note that our short-term views may differ from our
big picture view.
Bond yields (long-term interest
rates) will move higher into 2002.
The US stock market is in a
cyclical bull market that began in late-March/early-April and is likely
to end during the final quarter of this year.
The Dollar will head lower into
2002.
A bull market in gold stocks
commenced in November 2000 and is likely to extend into 2002.
Commodity prices, as represented
by the CRB Index, are in the process of bottoming. The CRB Index will reverse
higher during the second half of 2001 and rally into 2002.
The oil price will resume its
major uptrend during the second half of 2001 and rally into 2002.
The Bubble
Trend
Below is an updated version of a chart
comparison we've shown a couple of times in the past. It illustrates that
the 12-month rate-of-change for the S&P500 Index has trended in the
same direction as the yield on the T-Bond since mid-1997.
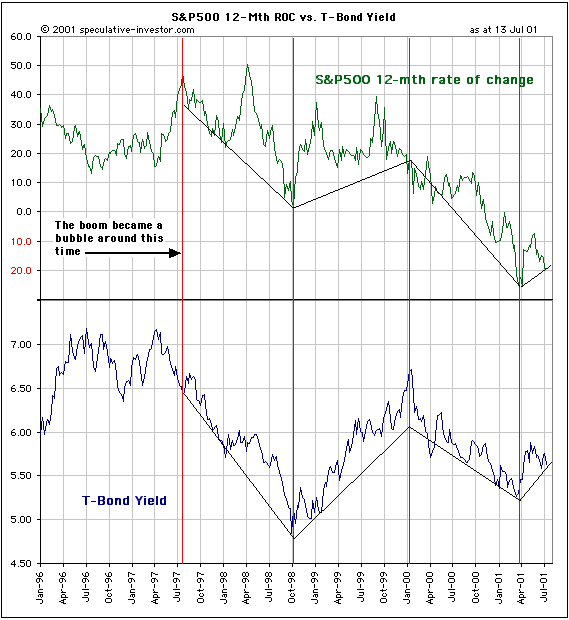
Long-term interest rates and equity
market returns have been moving in the same direction for so long now that
it seems normal for them to do so. It seems normal that every time bond
prices trend lower for a few months, the stock market trends higher, and
vice versa. It is, however, abnormal behaviour. Periods when rising
interest rates occur in parallel with rising stock prices, or when falling
interest rates occur in parallel with falling stock prices, have certainly
happened in the past (prior to mid-1997), but such periods have seldom
extended for longer than about 6 months. Under normal circumstances, rising
bond prices (falling long-term interest rates) are a net-positive for the
stock market and falling bond prices (rising interest rates) are a negative
influence on stock prices. The reason this is so is that the present value
of a company's future cashflow becomes less as interest rates rise.
When the bond market and the stock
market move in opposite directions for a prolonged period it is a sign
that either a) the economy is experiencing deflation, or b) the economy
is experiencing a credit bubble. With the total supply of money having
grown at a mind-boggling pace over the past 4 years the US has clearly
not experienced anything remotely resembling deflation, nor is it likely
to any time soon. With the inverse relationship between stocks and bonds
now about to enter its 5th year it is clear that the US economy is under
the influence of one of the all-time great credit bubbles.
We can use the current inverse relationship
between bonds and stocks in three ways. Firstly, as long as we have good
reason to believe that the credit bubble is still in existence then our
bond market view should, beyond the very short-term, be the opposite of
our stock market view. For example, if we expect the major stock market
indices to move much higher over the coming 3 months (this is what
we expect), then we should also expect bond prices to move lower over this
period. Secondly, we can use a move in one market to confirm a move in
the other market. For example, if a multi-week decline in stocks was not
accompanied by a multi-week rally in bonds then we would have cause to
be skeptical about the sustainability of the stock market decline. Thirdly,
we will know that the bubble has ended when we see stock prices and bond
prices moving sharply lower in unison.
Returning to the above chart we have
indicated, via a vertical red line, that the beginning of April this year
marked another major turning point in the stock and bond markets. We are
using some artistic license here since the trends are not yet well-defined,
but the fact that both markets reversed direction at that time lends some
support to the idea that early-April did, in fact, give us an important
turning point in the markets.
As an aside, something that has occurred
during the final stages of previous major credit bubbles is weakness in
the currency of the country experiencing the bubble. As such, we expect
to see a substantial and prolonged decline in the Dollar's foreign exchange
value before the present US credit bubble comes to an end.
Commodities
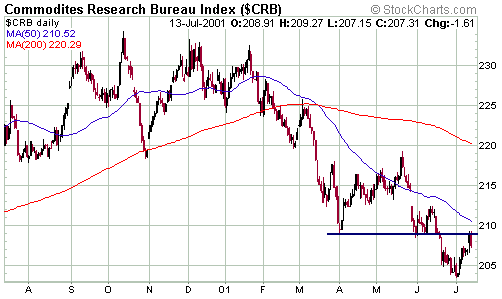
Below is a chart of the CRB Index.
The CRB Index is clearly in a downtrend and, as yet, it shows no sign of
bottoming. As mentioned in a previous commentary, we consider the CRB's
decline since late last year to be a correction within an on-going bull
market. As such, we do not expect the mid-1999 lows to be breached and
expect the next rally (which should commence by September and extend until
at least the middle of next year) to take the Index above last year's peak.
In the latest Interim Update we included
charts of the A$ and the C$ (known as "the commodity currencies" because
Australia and Canada rely heavily on commodity exports). Since these currencies
tend to lead commodity prices we will not turn short-term bullish on the
CRB Index until both the A$ and the C$ break-out above the downtrends shown
on these charts.
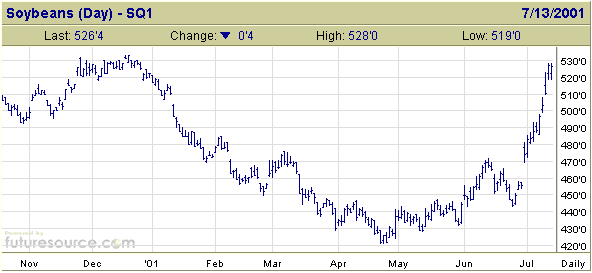
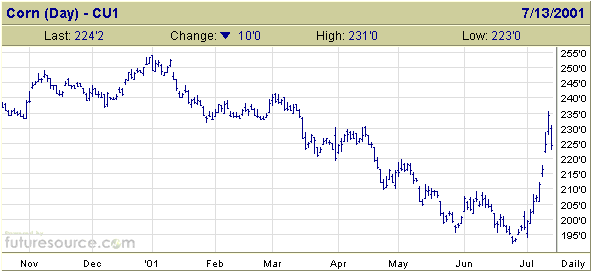
Although the CRB Index is mired in
a medium-term downtrend, some commodities are showing definite signs of
life. Soybeans appear to have commenced a bull market in April, while corn
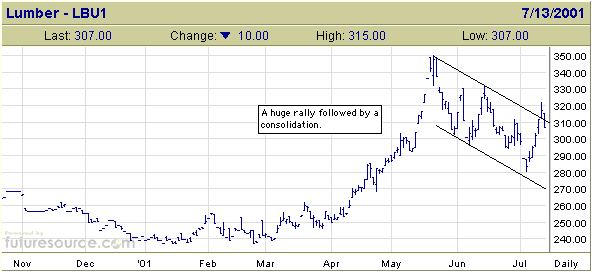
and wheat prices have recently begun following 'the beans' higher. Lumber
prices soared earlier this year and now seem to be experiencing a normal
correction. The following charts are provided courtesy of www.futuresource.com.

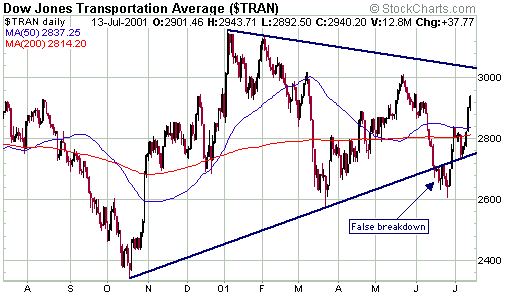
It is always nice when a move in one
market is confirmed by a move in a related market. The stocks of transport
companies tend to move inversely to the oil price since fuel is such a
major component of these companies' operating costs. The transport stocks
(as represented by the Dow Transportation Average) have recently been strong,
thus confirming the drop in energy prices.
Another
"Peso Problem"
Options trader and author Nassim Taleb
coined the term "peso problem" to describe a situation whereby a security
or trading strategy that has exhibited great stability and produced excellent
returns over a long period of time suddenly, and unexpectedly, crashes.
The term derives its name from the Mexican peso which, over the past 20
years, has experienced lengthy periods of stability interrupted by short
periods of extreme turbulence. The attractive yields that can be earned
on peso-denominated debt entice a huge amount of investment during the
periods of stability. Everything seems wonderful until one day the peso
suddenly plunges and interest rates go through the roof, quickly wiping
out all the gains that were made over the previous period of stability
and causing many of the yield-chasing speculators to 'blow up'.
All of our readers are undoubtedly
familiar with the on-going Argentinean financial crisis. The Argentine
peso is pegged to the US$, so the bulk of the stress is being felt in the
debt market where Argentinean bond yields have risen to 36%. The crisis
has over-flowed into neighbouring Brazil - the Brazilian real has plummeted
against the Dollar and interest rates have risen dramatically. Strangely
enough, however, the Mexican peso has, to date, been relatively unscathed
by the crisis. In fact, although the Mexican peso dropped 2% against the
Dollar last week it is the world's best performing currency so far this
year.
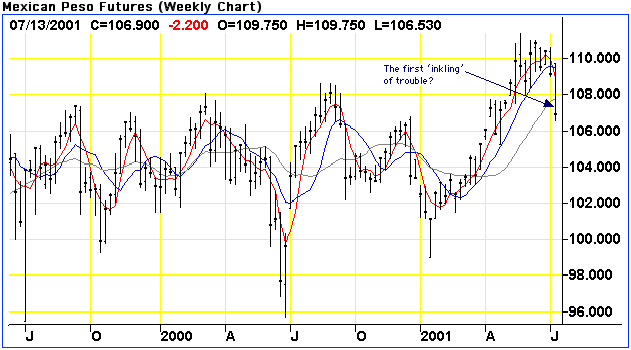
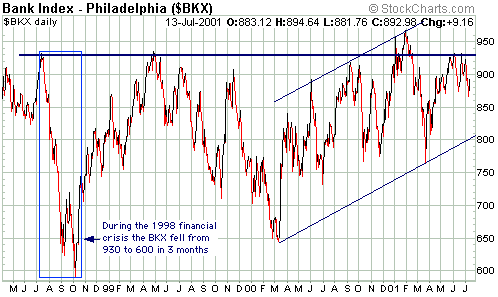
To ascertain whether the present crisis
will be 'contained' or whether it will lead to a global panic as happened
in 1998, we will be watching both the Mexican peso and the Bank Stock Index
(see charts below). If this crisis is going to broaden then we should soon
start to see substantial weakness in the Mexican peso (as speculators try
to exit while they still can) and in the stocks of the major banks (the
major banks have immediate and direct exposure to any such crisis).
The US
Stock Market
Stocks and Money
The monetary environment remains extremely
positive and will continue to underpin this cyclical bull market over the
next few months.
How important is a positive monetary
environment? Well, just think back on all the terrible corporate financial
news that has hit the market since early-April and look at where the major
stock indices are today compared to where they were back then. The news
and the forward-looking guidance from companies has been so bad over the
past 3 months that almost everyone has now given up on the second half
recovery story that was so popular a short while ago, yet the S&P500
and NASDAQ Composite are presently more than 10% above their early-April
lows. This has partly resulted from the extreme pessimism that prevailed
in late-March/early-April (everyone who was going to sell had already sold),
but mostly it is the result of the continuing flood of newly-created dollars.
We think the old saw "don't fight the
Fed" has little practical relevance these days since the Fed simply follows
along in the financial markets' wake, adding to market volatility but not
adding any real value. We prefer to think along the lines of "don't fight
the money supply".
We expect the money-supply growth rate
to soon reach its peak and by late this year or early next year the monetary
conditions will no longer be a positive influence on the stock market.
This is when major downside risk is likely to re-emerge - ironically, just
as the economy and corporate earnings are showing definitive signs of recovery.
Current Market Situation
We expect another 'testing' pullback
after the current rebound runs its course and before the main event (a
rally that takes the major indices well above their May-22 highs) gets
underway. Whether or not the next pullback takes the indices to new correction
lows will be determined by how high the market moves during the coming
week. If the September S&P500 can achieve a daily close above 1248
this week then the lows reached during the subsequent pullback would almost
certainly be higher than the recent correction low (reached on July-11).
We will monitor both price action and sentiment indicators in an attempt
to time another long-side speculation whilst continuing to hold the QQQ
call options purchased in late-June.
This week's important economic/market
events
| Date |
Description |
| Tuesday July 17 |
Industrial Production / Capacity Utilisation |
| Wednesday July 18 |
CPI
Housing Starts |
| Thursday July 19 |
Trade Balance
LEI |
| Friday July 20 |
July Options Expiration |
Gold and
the Dollar
Current Market Situation
The euro and the SF were not able to
break above their medium-term downtrends last week, but they remain poised
to do so. We expect these currencies to break-out to the upside soon, perhaps
as early as this week.
Gold was as flat as a pancake last
week. Upside breakouts in the European currencies will probably be needed
to 'kick start' the next gold rally. We doubt that gold will benefit from
the financial crisis that is brewing in Latin America unless the
crisis results in a drop in the US$.
Gold stocks drifted lower on very light
volume on Friday, thus under-performing the gold price following 3 days
in a row of out-performance. As mentioned in previous commentary, gold
stocks have moved with the spread between the yields on the 30-year T-Bond
and the 13-week T-Bill with great consistency over the past 12 months.
This relationship will not necessarily work on a daily basis, but whenever
long-term interest rates fall relative to short-term interest rates (as
was the case on Friday), gold stocks will face a significant head-wind.
The ideal environment for gold stocks would see interest rates increasing
at both the short-end and the long-end, but with long-term rates rising
more than short-term rates. Such an environment is likely to appear later
this year as a tentative economic recovery boosts short-term rates and
inflation fears cause long-term rates to surge. In the short-term, any
widening of the yield spread would most likely result from short-term rates
remaining flat, or even declining, while long-term rates drift higher.
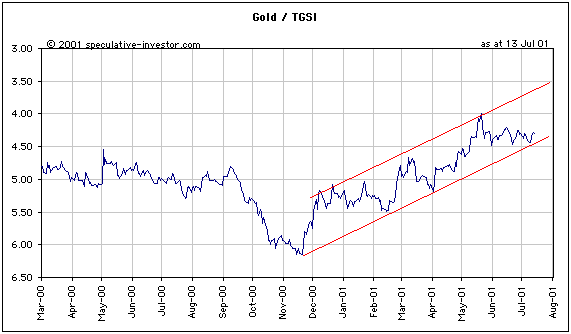
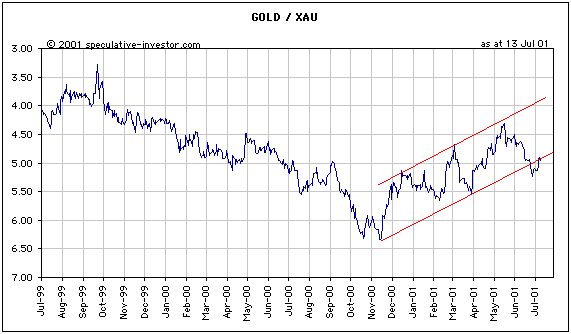
Below are updated charts of the gold/TGSI
ratio (TGSI is our own gold stock index and is a better representation
of the performance of gold stocks than is the XAU) and the gold/XAU ratio.
The gold/TGSI ratio remains within its up-channel, thus confirming the
continuation of the bull market that began last November, while the gold/XAU
ratio is making an attempt to return to its up-channel (note that the chart
scales are inverted so that a rising trend indicates out-performance by
the gold stocks).
Both gold and silver appear to be on
the verge of a rally. By declining to its March low and then bouncing silver
may, however, have left some unfinished business on the downside. Although
we would be more confident that a bottom was in place for silver if it
had spiked below its March 2001 low, we are going to give ourselves some
exposure to a potential rally in the silver price by adding Coeur d'Alene
Mines (NYSE: CDE) to the TSI Portfolio at $1.15 with an initial sell-stop
set at $1.05 (the stop would be activated on a daily close of $1.05 or
lower). CDE is not profitable at the current silver price and has a high
debt burden, meaning that it is high-risk and therefore not suitable for
a large investment. However, the things that make it unsuitable as an investment
give it a huge amount of leverage to any half-decent rally in the silver
price.
Changes
to the TSI Portfolio
CDE added at US$1.15.

|
