|
-- for the Week Commencing 19th February 2001
Forecast
Summary
 The
Latest Forecast Summary The
Latest Forecast Summary
Inflation
Update
A Big Picture View of Inflation
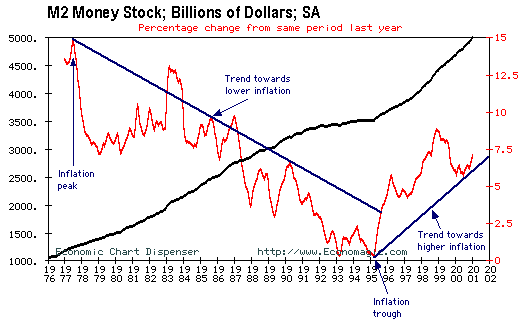
The below chart shows, in red, the
year-over-year percentage change in M2 (a measure of inflation) from the
mid-1970s through to January 2001. The chart reveals that the inflation
rate peaked in 1977 and bottomed in early 1995. From 1995 to the present
day there has been a pronounced trend towards higher inflation.

Paul Volcker is usually given credit
for reversing the trend towards higher inflation, but in reality the major
trend changed in 1977 whereas PV didn't take the wheel at the Fed until
1979. In fact, the year-over-year M2 growth rate fell sharply during the
2 years prior to PV taking over and actually rose during Volcker's first
4 years as Fed Chairman. We are not criticising Volcker - as far as Fed
Chairmen go, he was one of the best and is a super-hero in comparison to
his successor - just pointing out that, in the fight against inflation,
the 'trend was his friend'. Here's a quote regarding inflation from the
former Fed Chairman:
In the short term, it [inflation]
is good for borrowers and not for lenders. Once a lender begins anticipating
it, that equation changes, because he's going to say, "I expect inflation,
so I'm going to charge you more than I would otherwise charge you." And
you get higher interest rates, and the interest rates keep up with the
inflation. And in fact, human nature, they see inflation rising for a while,
they begin anticipating still higher inflation. So they say, "I'm not only
going to make up for today's inflation, but I'm going to anticipate tomorrow's
inflation."
What Didn't
Happen
Last Friday's financial market action
was very significant, not because of what happened but because of what
didn't happen. Firstly, the Dollar Index March Contract needed a weekly
close above 112.50 (112.50 was the Feb-09 intra-day high) to confirm strength
and project a continuation of the recent rally. This seemed like a foregone
conclusion after Thursday's move above 113, but thanks to Friday's sell-off
it didn't happen. Secondly, the stock market was hit with a barrage of
the worst possible news (terrible company earnings news, an inflation shock
and some unexpected hostilities in the Persian Gulf), but the NASDAQ Comp.
and NASDAQ100 did not make new correction lows. Thirdly, bonds did not
sell-off, despite the much higher-than-expected PPI. Fourthly, the Dollar
didn't rally in response to economic data (the higher PPI) that pointed
towards a lesser reduction in official interest rates than previously anticipated
(according to the Fed Funds Futures contract, the expected Fed Funds Rate
for July has just risen from 4.75% to 5.0%). Lastly, the euro did not close
the week below its down-trend (refer to the chart included in last week's
WMU).
The US
Stock Market
A Comparison of Bear Markets
There are a lot of differences
between the present US scenario and the aftermath of two other spectacular
stock market collapses - the early 1930s in the US and the early 1990s
in Japan. In particular, the following are worth noting:
a) The monetary system in place during
the 1920s and 1930s was a gold exchange standard, thus the ability of the
Fed to add liquidity was far more restricted than it is today.
b) During the 1930s every major government
in the world, except the US, defaulted on its debt. Under today's fiat
monetary system, however, government debt defaults are extremely unlikely
because governments have the power to create additional money as needed.
Direct debt defaults are hence replaced by surreptitious default through
inflation.
c) In Japan during 1990, the central
bank continued to raise interest rates for eight months following the collapse
of the asset price bubble.
d) During 1990s Japan the huge store
of personal savings, although insulating many Japanese citizens from the
collapse in asset prices, provided a political impediment to a 'reflation
agenda'.
e) The 1929 Dow crash and the 1990
Nikkei crash signaled an end to the underlying credit expansion, whereas
the recent US credit expansion continues despite the collapse of the NASDAQ's
speculative boom.
There are many other differences and
these differences ensure that the US of today will not follow the same
economic path as the US of the 1930s or Japan in the 1990s. This does not,
however, mean that the NASDAQ Composite Index will not follow the path
taken by the Nikkei during the early 90s or the Dow during the early 30s.
In fact, several analysts have done chart comparisons between the early-90s
Nikkei and the NASDAQ's recent past and have demonstrated an eerie similarity
between the two. One such comparison can be found at http://www.lowrisk.com/nasdaq-bear.htm.
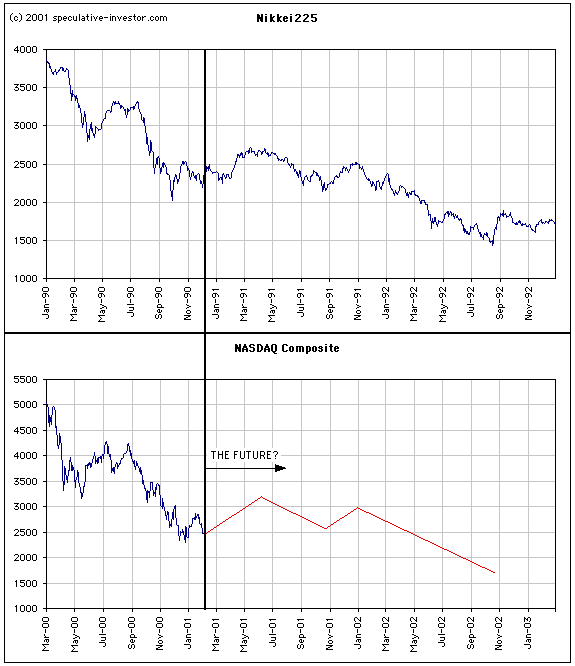
If the NASDAQ continues to trace-out a chart pattern that is similar to
that of the Nikkei then we should see a rally into May/June, a decline
into October, a rally into January 2002 and then a relentless 9-10 month
drop into a major bottom around October/November 2002. The following chart
illustrates the comparison to date (note the remarkable similarity) and
provides a rough 'road-map' for the next 18 months assuming the similarities
continue.

The projected 'road-map' shown on the
above chart bears such a close resemblance to our current forecast (particularly
as far as 2001 is concerned) that we will continue to check the actual
(real time) progress against it. In particular, if the similarities between
the two indices persist into the end of this year then a) 2001 will be
quite a good year for the NASDAQ, and b) 2002 will be a disaster.
Current Market Situation
Our short-term forecast remains the
same. We had expected that the NASDAQ100 would be the first major index
to bottom and that the Semiconductor Index (SOX) would lead the way higher.
So far so good as the SOX bottomed during the week before last and the
NASDAQ may have bottomed last week. The S&P500, however, hit a new
correction low on Friday. There is still no technical evidence of a turn
from down to up and the major indices are precariously positioned only
marginally above their early January lows.
We see no reason for traders to be
buying aggressively at this time, although the risk/reward ratio for the
QQQ (the NASDAQ100 Tracking Stock) is quite attractive at its current price
of around $55 provided that the potential downside is minimised
by setting an automatic sell-stop at $52.
If there is one group of stocks that
should
be under enormous downward pressure it is the semiconductor (chip) sector.
Since almost all computing and communication devices contain chips, a general
slowdown in Information Technology and Telecommunications equipment spending
(which is what we have been seeing for several months) would be expected
to hit the chip stocks harder than any other sector. However, the performance
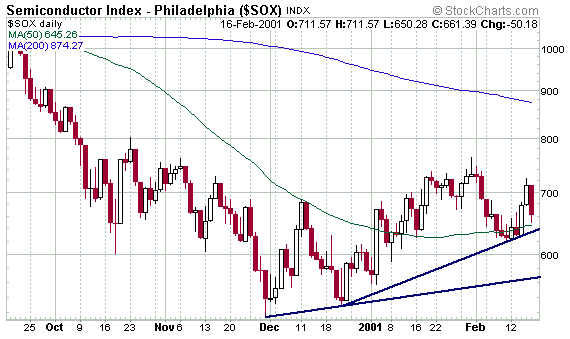
of this group of stocks, over the past 2.5 months, is at odds with the
obviously terrible fundamental backdrop. As the following chart shows,
the SOX bottomed in late November and has been trending higher ever since.

The above chart represents a huge divergence
between the 'news of the day' and the behaviour of the stock market. Divergences
such as this occur because the stock market is constantly trying to price
stocks today based on the way the fundamentals are going to look in several
months time.
This week's important economic/market
events
| Date |
Description |
| Monday February 19 |
US markets closed for President's
Day |
| Wednesday February 21 |
CPI
Trade Balance |
| Thursday February 22 |
Leading Economic Indicators (LEI) |
Gold and
the Dollar
The Gold Credit Expansion
Credit expansion inevitably cheapens
a currency. However, as noted in the Feb-12 WMU, the expansion of credit
requires both willing lenders and willing borrowers. It doesn't
matter if lenders offer extremely attractive terms to the borrowers, if
the borrowers choose not to accept those terms then credit cannot expand.
Similarly, a huge 'borrowing demand' will not lead to an expansion of credit
unless there are lenders willing to satisfy that demand. This point is
directly applicable to the gold market. Total gold loans are estimated,
by reliable sources, to be 10,000 to 12,000 tonnes, more than half of which
have been made in connection with gold mining company forward sales. The
central banks have offered to lend gold at attractive interest rates, but
without the willing borrowers - the gold producers - the volume of gold
loans could never have expanded to anywhere near its current extent. The
gold producers that have forward-sold large amounts of gold over the past
decade have made a significant contribution to the decline in the gold
price.
Until recently, the expansion of USD
credit had not led to a fall in the Dollar's relative value because the
growth in the investment demand for Dollars had more than offset the growth
in the supply of Dollars. In the gold market, with investment demand falling,
the producer-assisted expansion of gold credit has substantially increased
the depth of the decline in gold's relative value. And to what end? As
illustrated by the chart presented in the Nov-13 WMU, the stock prices
of the major unhedged gold producers have tended to keep pace with those
of the major hedged gold producers during periods of gold price weakness
and have dramatically out-performed during the rare periods of gold price
strength. From a shareholder's perspective it seems that the forward selling
of gold limits the upside (in the stock price), but is not effective in
minimising the downside.
Bonds and the Dollar
As noted earlier, the Dollar sold off
and bonds moved higher on Friday even though the 'news' could have been
construed as 'dollar-bullish' and 'bond-bearish'. How the market reacts
to news often provides an important clue regarding the future 'path of
least resistance'. For example, two week's ago we mentioned that the rally
in the Dollar following the release of the January Employment Report was
Dollar-bullish because the market chose to ignore the higher-than-expected
unemployment rate and focus, instead, on the healthy job creation number.
The Dollar was then able to rise over the ensuing 2 weeks. The market's
reaction to Friday's news is, we think, a signal that significant moves
are about to commence - down for the dollar and up for bonds. This conclusion
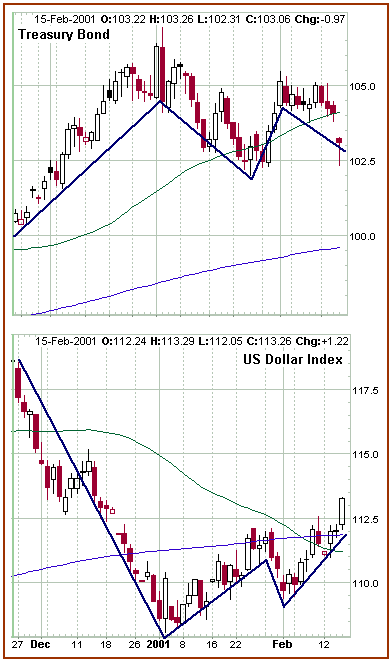
is given some weight by the fact that, as illustrated in the following
chart comparison, bonds and the Dollar have moved in opposite directions
on almost a daily basis since late November 2000. With the Dollar approaching
an 'overbought' condition and bonds approaching an 'oversold' condition
we expect substantial moves (up for bonds, down for the dollar) to begin
shortly (by the first week of March at the latest).

The Fed is likely to continue to cut
interest rates regardless of the inflation data. They have no choice -
the excesses (debt levels) are so great that a failure to keep the financial
markets liquid (through the further expansion of credit) would be catastrophic.
So, USD liquidity will be maintained at all costs, which is 'dollar-bearish'
and 'gold-bullish' (since 'gold credit' cannot be expanded at anywhere
near the pace of USD credit). It is also 'bond-bullish' until the
lenders begin to anticipate tomorrow's inflation. Once the market begins
to anticipate higher levels of inflation, bonds and the Dollar should decline
together.
Current Market Situation
As noted above we expect the Dollar
to reverse lower, if not immediately then by the first week of March at
the latest. When this happens we should see gold and gold stocks move higher.
As outlined in the Feb-12 WMU, the time to re-establish short-term trading
positions will be after the TSI Gold Stock Index (TGSI) breaks above
its current down-trend. If history is any guide, a break of the down-trend
will lead to an explosive rally over the ensuing 3-6 months. We will also
consider doing some 'bottom fishing' if the gold price drops into the 250-253
range or the TGSI moves down to around its November 2000 low.
Following is a list of points we wanted
to mention but have no chance of fitting into a flowing commentary:
a) The latest Commitments of Traders
(COT) Report (as at Feb-13) shows that the Commercial net-long position
in COMEX gold futures increased by around 8,000 contracts from the previous
week and now stands at 62,000 contracts. This is a similar level to that
of September 1999, just prior to a quick-fire $80 up-move in the gold price.
As far as we are concerned, the COT is important from one perspective only
- substantial gold rallies almost always begin when the Commercials
are significantly net-long. However, the COT is not a useful market-timing
tool because the Commercials will regularly take a position many months
prior to a turn occurring. Furthermore, although rallies tend to start
when the Commercials are net-long, most of the upside usually occurs
after they become net-short. If gold began to rally from current
levels we would expect the Commercials to be net-short before the price
reached $280. Here is a link to a set of charts showing traders' commitments
versus the gold price: http://www.cairns.net.au/~sharefin/Markets/Charts/COTAU.htm
b) The largest gold/precious metals
mutual fund - the Vanguard Gold and Precious Metals Fund - only has one
gold stock (Franco Nevada) in its top 10 holdings, and it is the number
10 holding! It's a fair bet that sentiment towards gold is near rock bottom
when even a gold mutual fund is steering clear of gold stocks.
c) Last week Gold Fields Limited announced
that it had taken advantage of the recent gold price weakness to buy back
its only hedge position - 160,000 oz of forward sales. It is now totally
unhedged. If only some of the companies with large forward-sales books
would follow suit!
d) Placer Dome (PDG) issued its Q4
and full-year earnings reports last week. It is worth noting that 24% of
PDG's revenue came from copper mining last year and that copper revenue,
as a proportion of total revenue, is likely to approach 30% in 2001. The
good news is that PDG substantially reduced the size of its forward-sales
book last year by delivering gold into forward-sales contracts and not
initiating new contracts. The bad news is that it does not plan any further
reduction in its hedge book (meaning that new forward sales contracts will
be established this year). If PDG was the only gold stock in the world,
we would own it. Luckily, it is not.
e) Our opinion is that investors wanting
exposure to gold stocks would be better-off purchasing the stocks directly
than buying gold mutual funds. The mutual funds often have their heaviest
weightings in stocks that are likely to under-perform during the next gold
bull market (eg, PDG and ABX). Our preferred long-term exposure to gold
is via Harmony, Gold Fields, Franco Nevada and Normandy.
f) The Daily
XAU Chart has been updated.
Changes
to the TSI Portfolio
No changes. Note that we haven't yet
taken the loss on CPTH - we will wait for the panic selling to subside
and see where the stock settles.

|

