|
-- Weekly Market Update for the Week Commencing 21st January 2008
Big Picture
View
Here is a summary of our big picture
view of the markets. Note that our short-term views may differ from our
big picture view.
Bonds commenced a secular BEAR market in
June of 2003. (Last
update: 22 August 2005)
The stock market, as represented by the S&P500 Index, commenced
a secular BEAR market during the first quarter of 2000, where "secular
bear market" is defined as a long-term downward trend in valuations
(P/E ratios, etc.) and gold-denominated prices. This secular trend will bottom sometime between 2014 and 2020. (Last update: 22 October 2007)
The Dollar commenced a secular BEAR market during the final quarter of 2000. The
first major downward leg in this bear market ended during the first
quarter of 2005, but a long-term bottom won't occur until 2008-2010. (Last update: 28 March 2005)
Gold commenced a
secular bull market relative to all fiat currencies, the CRB Index,
bonds and most stock market indices during 1999-2001. This secular trend will peak sometime between 2014 and 2020. (Last update: 22 October 2007)
Commodities, as
represented
by the CRB Index, commenced a secular BULL market in 2001. The first
major upward leg in this bull market ended during the second quarter of
2006, but a long-term
peak won't occur until at least 2008-2010. (Last update: 08 January 2007)
Copyright
Reminder
The commentaries that appear at TSI
may not be distributed, in full or in part, without our written permission.
In particular, please note that the posting of extracts from TSI commentaries
at other web sites or providing links to TSI commentaries at other web
sites (for example, at discussion boards) without our written permission
is prohibited.
We reserve the right to immediately
terminate the subscription of any TSI subscriber who distributes the TSI
commentaries without our written permission.
Outlook Summary
Market
|
Short-Term
(0-3 month)
|
Intermediate-Term
(3-12 month)
|
Long-Term
(1-5 Year)
|
Gold
|
Bullish
(19-Nov-07)
|
Bullish
(12-Nov-07)
|
Bullish
|
US$ (Dollar Index)
|
Bullish
(11-Jun-07)
| Bullish
(31-May-04)
|
Neutral
(19-Sep-07)
|
Bonds (US T-Bond)
|
Neutral
(02-Jan-08)
|
Neutral
(23-Jul-07)
|
Bearish
|
Stock Market (S&P500)
|
Neutral
(02-Jan-08)
|
Neutral
(26-Mar-07)
|
Bearish
|
Gold Stocks (HUI)
|
Bullish
(14-Jan-08)
|
Bullish
(14-Jan-08)
|
Bullish
|
| Oil | Bearish
(14-Jan-08)
| Bearish
(22-Oct-07)
| Bullish
|
Industrial Metals (GYX)
| Neutral
(28-Nov-07)
| Bearish
(09-July-07)
| Bullish
|
Notes:
1. In those cases where we have been able to identify the commentary in
which the most recent outlook change occurred we've put the date of the
commentary below the current outlook.
2. "Neutral", in the above table, means that we either don't have a
firm opinion or that we think risk and reward are roughly in balance with respect to the timeframe in question.
3. Long-term views are determined almost completely by fundamentals,
intermediate-term views by giving an approximately equal weighting to
fundmental and technical factors, and short-term views almost
completely by technicals.
Yearly Forecast
Included in TSI commentaries
over the past two weeks were our 2008 forecasts for stocks, bonds, the
US$, gold and gold stocks. We've consolidated these forecasts into a
single document and posted it at http://www.speculative-investor.com/new/yearly.asp.
Bad Economics
...the smaller the eventual stimulus package the better because the less harm it will do
There's a lot of talk about trying to stave off a recession using a
combination of monetary and fiscal stimulus, but you can't stave off a
recession that began months ago. And in any case, how could a recession
possibly be avoided, or even postponed, by creating more money out of
thin air? (Regardless of whether the stimulus comes in the form of tax
cuts or increased government spending or lower interest rates, it boils
down to creating money out of thin air since there isn't an existing
supply of spare money at the disposal of the monetary authorities). If
it were possible to do so then no country would ever have to experience
a recession since officialdom always has the power to increase the
money supply.
The idea that the government and the central bank should take steps to
increase the supply of money to counteract an economic slowdown is
based on the Keynesian fallacy that recessions are caused by
insufficient aggregate demand. Nothing could be further from the truth.
Recessions occur because the inflationary policies of the government
and the central bank lead to the misdirection of investment, which, in
turn, results in a lot of the wrong stuff being produced. Putting it
another way, the problem revolves around the fact that inflation
distorts price signals, thus causing investment to be directed in ways
that would not be justified in the absence of the inflation. You can't
fix this problem by creating more inflation, and yet more inflation is
the solution being advocated by almost everyone!
All the central bank and government can reasonably hope to achieve by a
so-called "stimulus package" is a reduction in the purchasing power of
the currency. This may hoodwink some people into believing that things
are getting better, but actually things will be getting worse because
the new inflation will lead to another round of misdirected investment.
Strangely, considering the almost universal acceptance of the idea that
a stimulus package is needed, the sorts of proposals that are being
advocated to address the current downturn have been tested and fallen
flat on their faces many times in the past. That is, it's not like
there isn't a mountain of empirical evidence to back-up the theory that
fiscal/monetary "stimulus" hurts more than it helps. In fact, we only
have to look back to the early years of this decade to see just how
'effective' the combination of massive monetary and fiscal stimulus can
be.
Massive stimulus in the form of slashed interest rates, substantial tax
cuts and a dramatic increase in government spending was implemented
during 2001 in reaction to the economic downturn that began with the
bursting of the NASDAQ bubble the year before, but the US economy
remained in recession until mid-2003 (the US Government claims that the
recession ended in November of 2001, but real-world observations tell
us that recession-like conditions remained until at least the middle of
2003). Furthermore, the strong downward trend in the US stock market
persisted for almost two years following the implementation of the
combined monetary and fiscal stimulus. The stimulus measures put in
place to address the economic downturn that began in 2000 were,
however, largely responsible for inflating the gigantic
mortgage-lending bubble. And we can see how well that turned out!
Creating a lot of money out of thin air will always have the effect of
pushing-up prices somewhere in the economy, but it can't stimulate real
growth. As a result, the downturns in the stock market and the economy
will run their natural courses regardless of whether or not a stimulus
package is implemented. Actually, the smaller the eventual stimulus
package the better because the less harm it will do.
Commodities
Base Metals Update
The LME copper inventory has begun to decline, perhaps due to
re-stocking by China. Also, the copper market looks like it is about to
return to a 'backwardated' state (the spot price has begun to increase
relative to the 3-month futures price, indicating a tightening
near-term supply/demand situation). These factors, along with the price
action, make us short-term bullish on copper. However, the other base
metals do not look as good. There are preliminary indications that the
nickel market is turning the corner (becoming more bullish), but zinc
and lead still look bearish.
Natural Gas Update
The natural gas (NG) price has perked up over the past few weeks on the
back of a larger-than-expected reduction in the amount of NG in
storage. According to the EIA's latest Weekly Natural Gas Storage Report,
the current inventory level is 8.7% below last year's level. However,
it remains 6.7% above the 5-year average for this time of the year.
If the NG inventory in the US falls even slightly more than expected
over the next few weeks then a substantial price rise would be the
likely outcome. This is due to the current structure of the NG futures
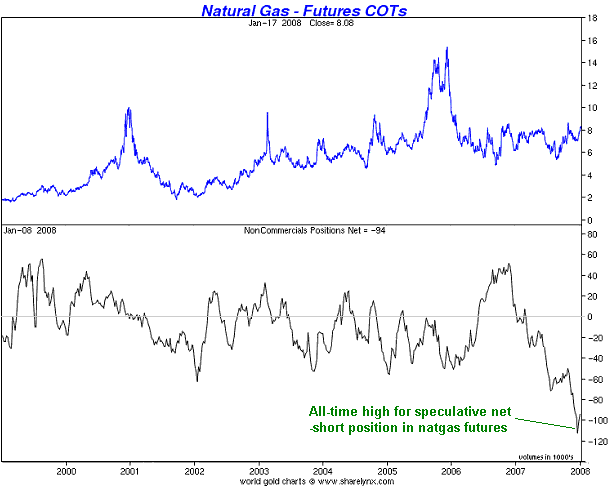
market, as highlighted by the following sharelynx.com
chart. The chart shows that the speculative net-short position in NG
futures has just hit an all-time high, leaving the market acutely
vulnerable to any bullish news and mitigating short-term downside risk.
We featured Daylight Resources (TSX: DAY.UN), one of the Canadian
'gassy' trusts in the TSI Energy Trust Index (TETI), as a buy in the
19th November 2007 Weekly Update when it was trading at C$6.55. Our
conclusion, at that time, was that the trust's distribution yield of
18.3% was unreasonably high given that there didn't appear to be much
risk of a distribution cut. DAY.UN has since risen to C$7.53, reducing
its yield to 15.9%. This, however, still appears to be an unreasonably
high yield considering that the trust's payout ratio is a very low 43%
(a low payout ratio reduces the risk of a distribution cut).
When we compare DAY with other trusts we come to the conclusion that
its yield should be around 14%, meaning that its price should be around
C$8.50. It therefore still looks like a strong buy in the C$7.50s or
lower.
Palladium
The palladium market is an enigma in so much as the main use of
palladium is the same as the main use of platinum (the demand for both
metals is driven primarily by their use in auto catalysts), and yet
palladium is currently priced at only $375/ounce while platinum trades
at more than $1500/ounce. This huge price discrepancy is strange, to
say the least, and suggests huge upside potential for palladium, but
there's no telling how long it will take for this upside potential to
be realised.
The price discrepancy between palladium and platinum appears to be
related to the Russian stockpile of palladium in that the continuing
release of metal from this stockpile is keeping the market in surplus.
Unfortunately, the size of the stockpile is a well-kept secret, as is
the plan of the Russian insiders who control the release of the metal
into the world market.
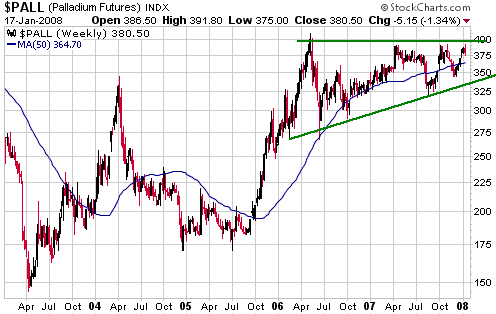
That having been said, palladium's weekly price chart (see below) has a
bullish tinge courtesy of a sequence of rising lows within the context
of very lengthy consolidation pattern. More often than not, patterns
such as this end via upside breakouts.
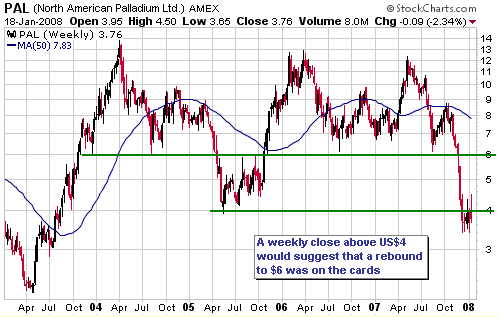
One way to 'play' the potential for an upside breakout in the palladium
price is via North American Palladium (AMEX: PAL, TSX: PDL), a stock
that we mentioned as a trading opportunity in the 2nd January Interim
Update. PAL is still at roughly the same price (US$3.70-3.80) and still
looks like a reasonable trade.
Also, those willing to take-on more risk in exchange for a potentially
greater reward could consider the PAL warrants (AMEX: PAL.WT, TSX:
PDL.WT). These warrants have a strike price of US$5.05 and an expiry
date of 13th December 2009. At the current stock price of US$3.76 we
estimate the fair value of the warrants to be US$0.65-0.75 (they closed
at US$0.65 on Friday).
Uranium
The uranium price has been steady at around $90/pound for more than two
months. By historical standards this is a very high price and should be
supportive for the stocks of uranium-mining companies, but this hasn't
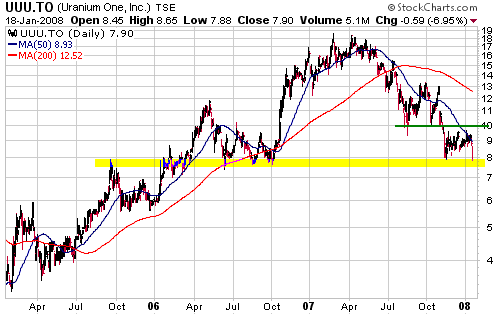
been the case as most uranium stocks have remained under pressure. For
example, the following chart shows that the stock price Uranium One
(TSX: UUU), a fast-growing mid-tier uranium producer, has dropped back
to near its lows of the past two years.
We have been anticipating a strong rebound in the uranium sector from a
Q4-2007 low to around April of 2008 due to a) the resilience of the
underlying commodity market, b) the fact that the huge decline in this
sector from its Q2-2007 peak has created significant value and caused
most uranium stocks to become dramatically oversold, and c) the
cyclical/seasonal tendencies of the sector. The start of this rebound
has been delayed by the weakness in the broad stock market and the
associated market-wide increase in risk aversion, but with the overall
market now primed for a rebound of its own we will hopefully get some
strength in the uranium stocks over the coming 1-2 months.
As far as new buying is concerned, our preferences at this time are Uranium One (TSX: UUU) and Energy Fuels (TSX: EFR).
The Stock
Market
Considerable technical damage
has occurred in stock markets throughout the world. For example, the
following chart shows that France's stock market has clearly broken a
multi-year upward trend and is now trading at its lowest level since
September of 2006.
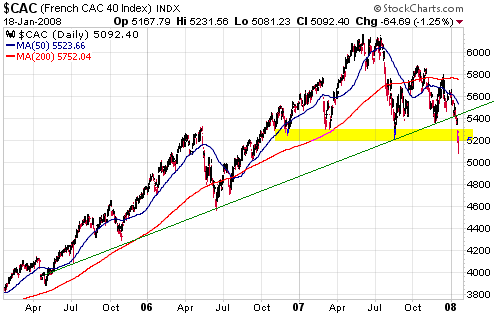
The downside breakout
in France's CAC40 Index creates a technically-based target in the
low-4000s, or almost 20% below the current level. There are other
markets, however, that could be much closer to their ultimate
correction (or bear market) lows. For example, we noted in last week's
Interim Update that as a result of its recent plunge the downward move
in Hong Kong's Hang Seng Index was very likely at least two-thirds
complete. There is also a reasonable chance that Japan's stock market
is close to its ultimate correction low.
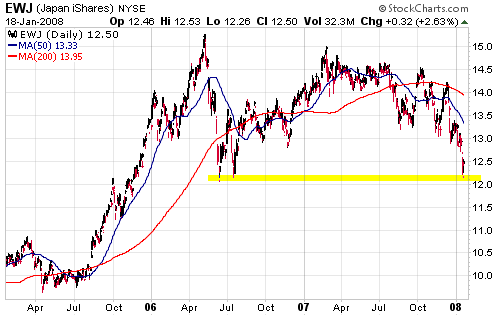
Unlike many other stock markets, which only entered correction mode
over the past few months, the following chart of EWJ (iShares Japan)
reveals that the Japanese stock market has been consolidating since May
of 2006. In other words, the correction (or cyclical bear market) in
Japanese equities is already quite 'long in the tooth'. Furthermore,
there was an impressive upward reversal in the Nikkei225 Index on
Friday and EWJ has just rebounded from near long-term support.
It will be difficult for Japan's stock market to make much headway
until after the US stock market reaches an intermediate-term bottom,
but for valuation and technical reasons we think the Japanese market
will end the year with a solid gain.
As far as the US
stock market is concerned, sentiment continues to hit the sorts of
pessimistic extremes that are seldom seen. For instance:
1. The 10-day moving average of the equity put/call ratio ended last
week at 0.85, which is the highest reading since Feb-2003 and is only
slightly lower than it was near the major bear market bottom of
Oct-2002. In fact, over the past 10 years the 10-day moving average of
the equity put/call ratio has only been significantly above its current
level on two occasions -- Feb-2003 (a few weeks prior to the start of a
multi-year bull market) and Sep-2001 (at the completion of the
terrorism-related market collapse).
2. The proportion of NYSE stocks above their 200-day moving averages
has dropped to within a few percent of where it was at the bottom of
the 2000-2002 bear market.
3. The proportion of NASDAQ stocks above their 200-day moving averages
is now as low as it was at the bottom of the 2000-2002 bear market.
Given the news backdrop and the likelihood that the news will become
even worse it is very easy to be bearish at this time. However,
sentiment indicators warn that a large proportion of market
participants have already acted in anticipation of worse news. This
leaves the market vulnerable to a positive surprise and creates a
certain amount of immunity to additional negative developments in the
short-term.
We continue to think that a multi-week rebound will soon begin in order
to alleviate the extremely oversold condition that now prevails, after
which there will probably be a decline to new lows. It's possible that
the ultimate correction low will not be far below the current level,
but the risk of a much larger decline prevents our short- and
intermediate-term outlooks for the US stock market from being any
better than "neutral" despite the oversold extreme currently being
registered. The risk is that we are now at the equivalent of mid-March
2001, and that a 1-2 month rebound will be followed by a much larger
decline.
Note that there will almost certainly be a 50-basis-point official rate
cut in the US within the next several days. For the reasons discussed
earlier in today's report this won't have a significant REAL effect on
the US economy, but it could be the catalyst for the multi-week rebound
we are anticipating.
A favourite leading indicator outlives its usefulness
For many years the NDX/Dow ratio (the NASDAQ100 Index divided by the
Dow Industrials Index) was our favourite indicator of the US stock
market's intermediate-term trend. What we liked so much about this
indicator was its uncanny ability to reverse direction well in advance
of a trend change in the broad market.
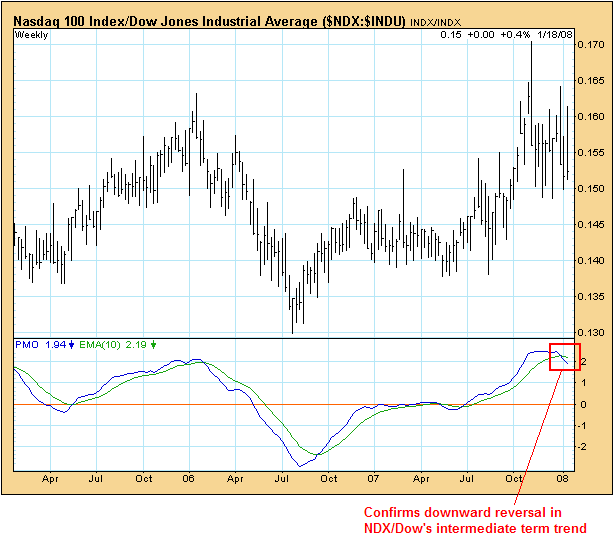
Unfortunately, NDX/Dow appears to have outlived its usefulness as a
LEADING indicator. We say this because, as evidenced by the following
weekly Decisionpoint.com chart, it has only just confirmed a downward
reversal. In years gone by this type of signal would have occurred 1-3
months PRIOR to an intermediate-term peak in the S&P500 Index, but
in this case the signal has been generated well into an
intermediate-term decline.
NDX/Dow used to be
such a good leading indicator because large-cap tech stocks -- the
types of stocks that dominate the NDX -- were widely considered to be
more risky than large-cap stocks in general. This meant that when
market participants started to become more risk averse, which is
something that almost always happens prior to the end of an
intermediate-term advance in the broad stock market, the NDX would
start to weaken relative to the Dow. Now, however, large-cap tech
stocks are widely considered to offer relative safety, while financial
stocks such as banks are considered to be high-risk (there are no
financial stocks in the NDX). As a result, the first few months of the
stock market downturn that began last July were characterised by
STRENGTH in the NDX relative to the Dow.
This week's
important US economic events
| Date |
Description |
Monday Jan 21
| US markets closed for MLK Day
|
| Tuesday Jan 22 | No important events scheduled
| | Wednesday Jan 23
| No important events scheduled
| | Thursday Jan 24
| Existing Home Sales
| | Friday Jan 25
| No important events scheduled
|
Gold and
the Dollar
Gold
We wouldn't have a care in the world with regard to gold's prospects
over any timeframe if not for the current absurd euro optimism. The
euro's fundamentals are no better than those of the US$, yet the euro
trades at a huge premium to the US$. This creates a short-term risk for
the gold market in that many speculative long positions in gold are
predicated on the belief that the US$ will continue its relentless
decline against the euro. So even though a US$ rebound against the euro
SHOULDN'T be a significant negative for gold if it is driven by euro
weakness rather than genuine US$ strength, it probably would be a
significant negative due to current market psychology.
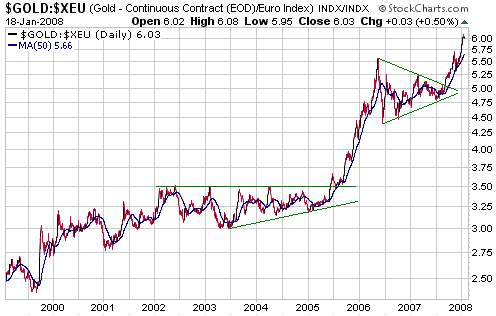
Below is a picture of gold's bull market in euro terms. Based on the
way the market traded once it broke out to the upside in 2005, the
extent of any pullback in the near future should be limited by support
defined by the November peak (575 euros) and the 50-day moving average
(566 euros and rising). That is, in euro terms the short-term downside
risk appears to be no more than 3-4%.
In US$ terms, we've
previously noted that short-term downside risk should be limited by
support at $850-$860 (basis the February futures contract). This also
implies short-term downside risk of 3-4%.
Gold Stocks
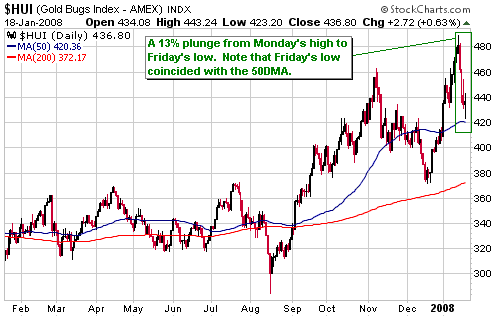
We had expected that a break by the HUI above resistance at 463 would
be followed by a surge to 480-500 and then a pullback to the 450s.
However, the gold sector has continued on its extra-volatile way and
actually traded as low as 423 on Friday morning after trading as high
as 489 just 4 days earlier. Friday's low might have to be tested at
some point over the coming fortnight, but in price terms the pullback
could essentially be complete even though it only commenced last Monday.
A significant plus
for the gold sector over the past two weeks has been the emergence of
more evidence that gold has embarked on a new intermediate-term advance
relative to oil. The evidence we are referring to is the break above
resistance illustrated by the following chart of the gold/oil ratio.
Oil is a major cost to gold-producing companies so a higher gold/oil
ratio means higher profit margins for gold producers.
The following chart
tells a story that we wouldn't have thought possible had we not watched
it unfold with our own eyes. The chart reveals that Gold Fields Ltd.
(NYSE: GFI), the best-managed and most under-valued of the major South
African gold stocks, has trended LOWER since May of 2006 in parallel
with a powerful UPWARD trend in the Rand-denominated gold price. In
fact, since May of 2006 there has been a 42% rise in the Rand gold
price and a 37% FALL in the Gold Fields stock price.
It will be
interesting to see GFI's Q4-2007 financial results, due at the end of
this month, and the Q1-2008 results, due to be reported at the end of
April. Based on what has happened to the Rand gold price, the Q4-2007
results should reveal strong profit growth and the Q1-2008 results
should be much better again. If this does not prove to be the case then
we will probably give up on GFI.
Update
on Stock Selections
(Note: To review the complete list of current TSI stock selections, logon at http://www.speculative-investor.com/new/market_logon.asp
and then click on "Stock Selections" in the menu. When at the Stock
Selections page, click on a stock's symbol to bring-up an archive of our comments on the stock in question)
 Australian Gold Stocks Australian Gold Stocks
We remain comfortable with our two Australian-listed gold stocks, even though neither of them has done very much as of yet.
Resolute Ltd. (ASX: RSG) is the most under-valued soon-to-be mid-tier
gold producer we know of. Its annual gold production is expected to
double from 250K to 500K ounces once the Mali-based Syama gold project
comes on line towards the end of this year, meaning that at Friday's
closing price of A$2.03 it is being valued by the stock market at less
than US$1000 per ounce of production. This is less than one-third the
industry average.
Investors are obviously sceptical regarding RSG's ability to achieve
the planned production and cost figures for Syama. This means that the
most likely catalyst for a major upward re-rating of the stock is
evidence that Syama is performing as planned, or the removal of the
risk-related discount as Syama gets closer to production.
In addition to the growth potential offered by Syama, RSG has stakes in
a number of very interesting exploration-stage projects for which it
currently gets almost no credit.
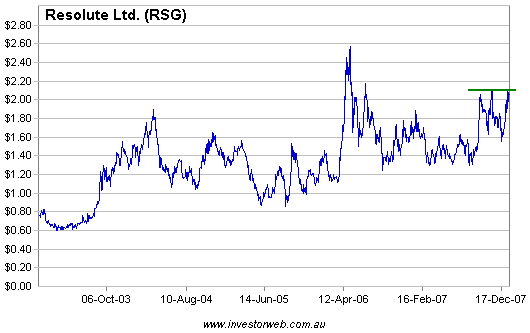
From a technical perspective (see chart below), the stock has
short-term resistance at around A$2.10 and solid support in the
A$1.60s.
Lion Selection (ASX:
LST) is a company that owns stakes in several small-cap miners and also
owns 30% of the Cracow gold mine in Queensland. At Friday's closing
price of A$1.61 it was trading at a discount of more than 20% to its
net asset value (NAV).
Although its current discount is excessive, it is quite common for
investment companies such as LST to trade at discounts to their NAVs.
It's possible, however, that early this year LST will have the
opportunity of evolving into an operating company by purchasing the
remaining 70% of the Cracow gold mine. We are not relying on this
opportunity coming to fruition, but if it does then the market will be
forced to change the way it values LST and the stock should experience
a substantial upward re-rating (profitable gold-mining companies tend
to trade at sizeable premiums to NAV).
Chart Sources
Charts appearing in today's commentary
are courtesy of:
http://stockcharts.com/index.html
http://www.futuresource.com/
http://www.decisionpoint.com/

|

