|
-- Weekly Market Update for the Week Commencing 22nd December 2003
Big Picture
View
Here is a summary of our big picture
view of the markets. Note that our short-term views may differ from our
big picture view.
Bond yields (long-term interest
rates) reached a major low in June of 2003 and will trend higher until
at least mid 2004.
The US stock market will reach
a major bottom (well below the October-2002 low) during 2004.
The Dollar commenced a bear
market in July 2001 and will continue its decline during 2003 and 2004.
A bull market in gold stocks
commenced in November 2000 and will continue during 2003 and 2004.
Commodity prices, as represented
by the CRB Index, will rally during 2003 and 2004 with most of the upside
occurring in 2004.
Copyright
Reminder
The commentaries that appear at TSI
may not be distributed, in full or in part, without our written permission.
In particular, please note that the posting of extracts from TSI commentaries
at other web sites or providing links to TSI commentaries at other web
sites (for example, at discussion boards) without our written permission
is prohibited.
We reserve the right to immediately
terminate the subscription of any TSI subscriber who distributes the TSI
commentaries without our written permission.
Merry Christmas!
Due to the Christmas holidays there
won't be any Interim Update this week, but the Weekly Update will be posted
at the normal time next Sunday.
Best wishes for the holiday season!
Inflation
What most people think of as inflation
are actually the probable consequences of inflation. And this confusing
of cause and effect leads to many misunderstandings.
Inflation is an increase in the supply
of money, but most people think of inflation as an increase in the general
price level because this is how they've been trained to think. As a consequence,
the inflation rate can be high but as long as the government reports a
low CPI every month it is widely accepted that an inflation problem does
not exist. Certainly, very few people will ever consider inflation to be
a problem when the inflation is pushing up the prices of stocks and real
estate while the prices that count, as far as the popular price indices
are concerned, remain subdued. It is only when the inflation starts to
affect goods and services prices to a greater extent than asset prices
that the inflation starts being perceived as a problem, not just by the
uninformed 'man in the street' but by analysts who should know better and,
most importantly, by those responsible for setting monetary policy. What
this means is that the difference between an environment that is perceived
to be inflationary and one that is perceived to be non-inflationary isn't
related to money supply growth so much as it is related to the prices that
are affected the most by changes in the money supply.
To further explain the above, let's
take a look at a long-term chart of M3 money supply (the red line on the
below chart shows the year-over-year change in M3, which is what we are
interested in).
Now, inflation was perceived to be
a problem during the 1970s and early 1980s and the above chart clearly
shows that the money-supply growth rate was high throughout this period.
Note, though, that the M3 growth rate actually peaked in 1971 whereas the
major inflation scares didn't occur until 1973-1974 and 1979-1980. The
inflation scares occurred as a result of surging gold, oil and other commodity
prices which were, in turn, a consequence of the weakening US$. The important
thing to understand, though, is that the US$ was weak due to inflation,
not just the inflation that occurred during the 1970s but the inflation
that had been occurring unabated for more than 10 years prior to the start
of the 1970s. If not for inflation the US$ would have remained convertible
into gold at $35/ounce and the Arabs would have been content to continue
selling their oil at $3/barrel.
At the current time we have a situation
that in some important respects is not dissimilar to the way it was in
the early-1970s. In particular, there has been massive inflation over the
past several years and the late-2001 peak in the money-supply growth rate
will probably turn out to be the peak for this decade. In other words,
if we define inflation correctly then the inflation rate has probably peaked.
What we expect, though, is that it will take many years for the full
effects of the massive dollar inflation of 1997-2003 to be reflected in
the value of the US$ relative to hard money (gold) and commodities.
Right now we are still early in the inflation cycle because most people,
including the bozos at the Fed, haven't even begun to perceive an
inflation problem.
The US
Stock Market
Time
During August of this year we speculated
that the US stock market might reach a major peak in October. However,
once October arrived with no significant weakness in the NDX/Dow ratio
and with none of our bearish early warning signals having been triggered,
our attention turned to early 2004 as being the most likely time for a
peak.
There are two reasons why early 2004
seems, to us, to be a likely time for a major peak (assuming, of course,
that the high valuations combined with the overtly bullish sentiment and
the weakening dollar will cause a major peak to form at some point in the
not-too-distant future). First, there is considerable precedence for important
stock market peaks in January. For example, major peaks for the Dow Industrials
Index occurred in January of 1966, 1973, 1994 and 2000. Second, when a
market has been trending strongly in one direction for almost the entire
year the trend will generally extend into the first quarter of the subsequent
year. In other words, once the upward trend in the stock market had made
it to November it was likely to continue until at least January.
Obviously, we don't know for certain
that a peak is going to occur in January. What we can say, though, is that
with a couple of exceptions (which are discussed below) the market action
over the past 6 weeks has been consistent with the idea that a major peak
will occur during the early part of next year. In particular, five of the
six bearish early warning signals described in the 17th November Weekly
Market Update have been triggered.
By the way, if a peak does occur in
January of 2004 a large decline probably won't get underway immediately.
As discussed in previous commentaries, the initial decline after a major
peak is typically followed by a rally that retraces at least 50%, and sometimes
as much as 100%, of the initial decline. This means that a January peak
could quite conceivably be followed by a March 'test' of the peak with
a substantial and prolonged decline not commencing until March-April. Note
that such a pattern (a January peak followed by a March test of the peak)
occurred in 2002.
If we are going to be wrong it probably
won't be because the market just moves relentlessly higher over the next
several months but rather because a peak in early 2004 turns out to be
of the intermediate-term, as opposed to the major, variety. The thing is,
most major declines start out looking like normal corrections and it is
only after a few important support levels give way that the majority of
market participants catches on to the fact that something different is
afoot. Given the fundamental and sentiment backdrop we think there's a
good chance that the next 'normal correction' will evolve into something
more sinister, but of course we will always remain open to the possibility
that we could be wrong.
>From a fundamental perspective, one
thing that could potentially make us wrong with regard to the extent of
any decline during the first half of 2004 is a dramatic upward reversal
in the money-supply growth trend. This, in turn, would require a very big
upward move in the bond market (that is, it would require much lower long-term
interest rates). In other words, we'll need to be especially alert to the
possibility that next year's stock market decline will end prematurely
if weakness in stocks leads to extreme strength in bonds and if this
bond market strength precipitates a powerful surge in money-supply growth.
That second "if" is the more difficult one because in order for a large
bond rally to generate a surge in money-supply growth it would be necessary
for US home-owners to react to the drop in long-term interest rates by
going on yet another mortgage-refinancing binge, monetising another few
hundred billion dollars of their collective home equity in the process.
This is exactly how they have reacted to every other substantial drop in
long-term interest rates over the past several years -- and why the money-supply
growth trend has followed the bond market with such remarkable consistency
-- but it is quite possible that US home owners/buyers, as a group, are
now 'tapped out'. We'll see.
Shades of 1999
December stock options, stock futures,
index options and index futures expired last Friday.
During the late-1990s and the first
half of 2000, 'option expiration' weeks almost always had an upward bias.
This was because the upward trend was so strong, particularly amongst the
leading tech stocks such as Cisco, Intel, Microsoft and Dell, that the
large-scale sellers of call options were continually being made to buy
stock during the days leading up to an options' expiration in order to
limit their risk. Without getting into the details, large sellers of options
typically take action to prevent their out-of-the-money options moving
into the money during the few days prior to options expiration. For a hedge
fund that has sold a heap of call options on a stock this might, for example,
involve short-selling some shares as the stock price approaches the strike
price of the options with the aim of capping the stock's price at, or below,
the strike price. However, in a strong market it is not unusual for this
defensive action to fail and when it does fail the large seller of the
call options is forced to buy stock or buy options aggressively in order
to limit their losses. This tends to push the stock price straight up to
the next strike price in the option series where the call-option sellers
will typically draw another line in the sand.
During the stock market rallies of
the past few years the large sellers of options have generally been quite
successful in limiting the gains achieved by the stocks against which they've
sold call options and expiration weeks have tended to be much like any
other week. However, this past week reminded us of 1999 and the first quarter
of 2000, except that rather than being the large-cap tech stocks that were
being dragged higher by options-related activity it was the large-cap 'old
economy' cyclical stocks that were the main beneficiaries. For example,
Caterpillar (NYSE: CAT) struggled for a while at the $80 strike price,
but once above $80 it moved to $85 in the blink of an eye. Also, within
two days of Phelps Dodge and Alcoa getting past the $70 and $35 strike
prices, respectively, they were trading at the $75 and $37.50 strike prices.
Current Market Situation
As mentioned above, the current market
action is consistent with our view that an important peak will be reached
during the early part of next year. In particular, the NDX/Dow ratio has
not only reversed lower in a decisive manner (as it should do prior to
a major peak in the broad market), but while the Dow Industrials Index
continues to make new highs on almost a daily basis the NDX has not yet
exceeded its 7th November high. In fact, despite a generally strong stock
market during the final four days of last week the NDX wasn't even able
to trade above last Monday's intra-day high. This, we think, is a significant
bearish divergence.
Note, though, that as well as some
potentially significant bearish divergences there are some bullish developments.
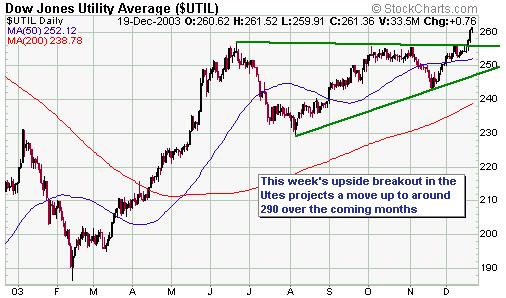
One such bullish development is the
upside breakout by the Dow Utilities Average (see chart below). As stated
in the 13th October Weekly Update, "The Utilities sector tends to be
strongly influenced by both the stock and bond markets and is therefore
a proxy for the performance of US financial assets (stocks + bonds). This
sector peaked with the bond market in June and then tumbled with the bond
market into the first half of August before rebounding up to, but not above,
its June high. A move to new highs by the 'utes' over the next few weeks
would be a positive omen for the combination of stocks and bonds,
meaning that near-term weakness in one market (stocks or bonds) would probably
be offset by near-term strength in the other."
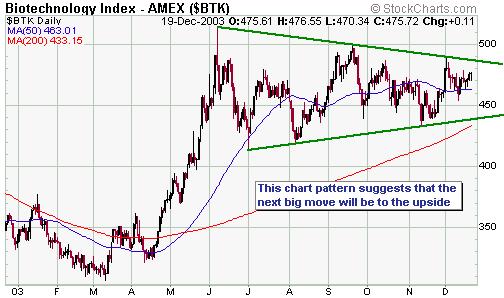
Another potentially bullish development
is the chart pattern of the Biotechnology Index (BTK). The BTK rocketed
higher between the first half of March and the first half of June and has
since moved sideways. When this type of lengthy consolidation pattern occurs
the eventual breakout is usually in the direction of the preceding trend.
In the BTK's case this would be up. Furthermore, an upside breakout from
this pattern would project a rally of around 100 points. This, however,
would not necessarily be in conflict with our forecast for a January peak
provided the upside breakout occurred very soon because the BTK is capable
of rallying 100 points in less than one month.
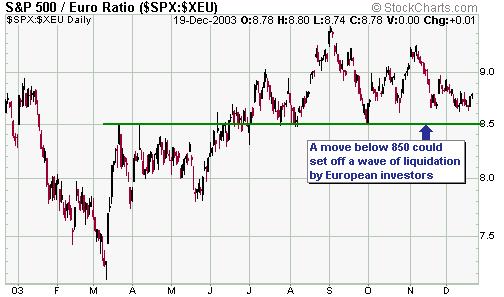
In US$ terms the S&P500 Index broke
out to the upside last week, but in terms of the euro it has made a sequence
of lower highs over the past 4 months (see chart below). European investors
in US stocks are therefore not benefiting from the rally.
The S&P500, when measured in terms
of the euro, is now only about 3% above critical support. We'll therefore
be watching the S&P500/euro ratio closely over the coming weeks because
a drop of only 3% or so from the current level has the potential to set
off a wave of liquidation from European investors.
The bottom line is that the market
is probably headed higher over the next few weeks. Our current intention
is to add a second position in an inverse index fund (USPIX) in January
if bearish divergences persist.
This week's important economic events
| Date |
Description |
| Monday Dec 22 |
No significant events |
| Tuesday Dec 23 |
Q3 GDP (final) |
| Wednesday Dec 24 |
Durable Goods Orders
New Home Sales |
| Thursday Dec 25 |
Markets closed for Xmas |
| Friday Dec 26 |
No significant events |
 Click
here to read the rest of today's commentary Click
here to read the rest of today's commentary

|
