


--
Weekly Market Update for the Week Commencing
23rd January 2017
Big Picture
View
Here is a summary of our big picture
view of the markets. Note that our short-term views may differ from our
big picture view.
The BULL market in US Treasury Bonds
that began in the early 1980s ended in early-2015, but there will be many years
of topping action in bond prices and bottoming action in bond yields before
major new trends get underway. (Last update: 29 June 2015)
The stock market, as represented by the S&P500 Index,
commenced
a secular BEAR market during the first quarter of 2000, where "secular
bear market" is defined as a long-term downward trend in valuations
(P/E ratios, etc.) and gold-denominated prices. This secular trend will bottom sometime between 2018 and 2020.
(Last update: 29 June 2015)
A secular BEAR market in the
US
Dollar
began during the final quarter of 2000 and ended in July of 2008. This
secular bear market will be followed by a multi-year period of range
trading.
(Last
update: 09 February 2009)
Gold commenced a
secular bull market relative to all fiat currencies, the CRB Index,
bonds and most stock market indices during 1999-2001.
This secular trend will peak sometime between 2018 and 2020.
(Last update: 29 June 2015)
Commodities,
as represented by the CRB Index, commenced a
secular BULL market in 2001 in nominal dollar terms. The first major
upward leg in this bull market ended during the first half of 2008, but
a long-term peak won't occur until 2018-2020.
(Last
update: 29 June 2015)
Copyright
Reminder
The commentaries that appear at TSI
may not be distributed, in full or in part, without our written permission.
In particular, please note that the posting of extracts from TSI commentaries
at other web sites or providing links to TSI commentaries at other web
sites (for example, at discussion boards) without our written permission
is prohibited.
We reserve the right to immediately
terminate the subscription of any TSI subscriber who distributes the TSI
commentaries without our written permission.
Outlook Summary
Market
|
Short-Term
(1-3 month)
|
Intermediate-Term
(6-18 month)
|
Long-Term
(2-5 Year)
|
|
Gold
|
N/A |
Neutral
(21-Nov-16) |
Bullish
|
|
US$ (Dollar Index)
|
N/A |
Neutral
(17-Aug-16) |
Neutral
(19-Sep-07) |
|
US Treasury Bonds (TLT)
|
N/A |
Neutral
(21-Nov-16)
|
Bearish |
|
Stock Market (DJW)
|
N/A |
Neutral
(14-Nov-16) |
Bearish |
|
Gold Stocks
(HUI)
|
N/A |
Neutral
(21-Nov-16) |
Bullish
|
|
Oil |
N/A |
Neutral
(26-Oct-15) |
Bullish
|
|
Industrial Metals
(GYX)
|
N/A |
Neutral
(10-Oct-16) |
Bullish |
Notes:
1. Our short-term expectations are discussed in the commentaries, but except in
special circumstances we won't attempt to assign a "bullish", "bearish" or
"neutral" label to these expectations.
2. The date shown below the current outlook is when the most recent outlook change occurred.
3. "Neutral" means that we think risk and reward are roughly in balance with respect to the timeframe in question.
4. Long-term views are determined almost completely by fundamentals and intermediate-term views
are determined by a combination of fundamentals, sentiment and technicals.
Last week's posts at the TSI Blog
The "war on cash" has nothing to do with fighting crime
Summary of current
thinking/positioning
1) Thinking that the rebounds in
gold, silver and the associated mining indices are not yet close to being
over, but on the lookout for profit-taking opportunities in individual
stocks.
2) Expecting intermediate-term tops in non-gold commodities
and the associated equities later this quarter. Looking for profit-taking
opportunities, but planning to maintain some long-term exposure. Hedged
via EEM and USO put options.
3) Thinking that the US Treasury Bond
has significant additional short-term upside (within a long-term bearish
trend).
4) Expecting an extension of the US equity bull market and
expecting a generally-bullish global equity trend, but concerned about
short-term downside risk.
5) Thinking that the Dollar Index is
immersed in a 2-3 month correction, after which its longer-term upward
trend will resume.
6) Maintaining a large cash reserve to hedge
downside risk in equities (current cash percentage is about 40%).
Yearly Forecast
Link
Our 2017 annual forecasts were
spread across three commentaries during the first half of this month. For
ease of reference, these forecasts have now been consolidated into a
single page at
http://www.speculative-investor.com/new/yearly.asp.
Commodities
Copper
The US$ copper price has essentially been in consolidation mode since
spiking up to the $2.70s in early-November. As previously mentioned, the
price action suggests the potential for a rise to around $3.00 prior to an
intermediate-term peak.
Critical (trend-defining) support remains
at $2.45 and a daily close below this support would leave little doubt
that an intermediate-term top was in place. However, it would be
reasonable to view a daily close below the 50-day MA as an early warning
of an intermediate-term reversal to the downside. The 50-day MA is now at
$2.57 (only 0.04 below the current price) and is rising.
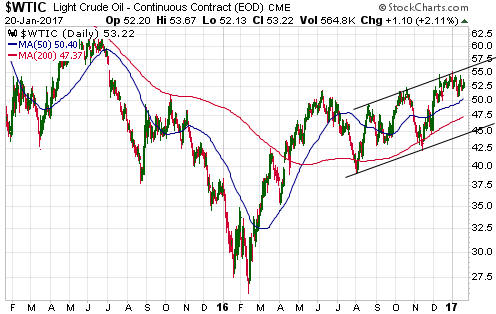
Oil
Recent oil-market speculation has been
linked to stock-market speculation. Therefore, with the Dow Industrials
and S&P500 indices having moved sideways near the tops of their 12-month
ranges over the past month it makes sense that the oil price has done the
same. The recent link between the two markets suggests that there won't be
substantial downside in the oil price until there is a sizable correction
in the stock market. Both are likely to occur during the first half of
this year, albeit at least a couple of months later than we originally
expected.
The oil price has short-term upside potential to the 2015
high in the low-$60s, whereas short-term downside potential is probably
limited by the 200-day MA near $47.
Our main oil-related concern is that speculative enthusiasm for the
commodity is out of synch with the commercial supply-demand situation.
This creates the risk that unless the fundamental situation becomes a lot
more bullish within the next few months, the price will have to move a lot
lower. We therefore think that the intermediate-term downside potential is
much greater than the short-term downside potential mentioned above.
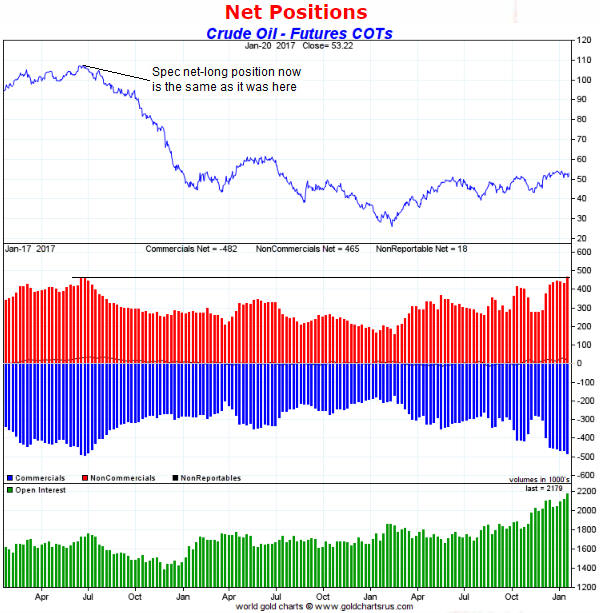
The current extent of speculative enthusiasm for oil is illustrated by
the following weekly chart from
goldchartsrus.com. The chart shows that the speculative net-long
position in oil futures rose last week to a 3-year high and is now roughly
the same as it was in June of 2014, when the oil price was around
$110/barrel. Putting it another way, the last time the speculative
net-long position in oil futures was as high as it is today the oil price
was about to commence a 6-month decline of more than 50%.
It is not reasonable to expect a 50% decline in the oil price over the
next 6 months, because oil is nowhere near as expensive relative to other
commodities as it was in mid-2014. However, the intermediate-term downside
risk is uncomfortably high. Consequently, we will be looking for
opportunities over the weeks ahead to purchase USO (oil ETF) put options
with a July-2017 expiry date.
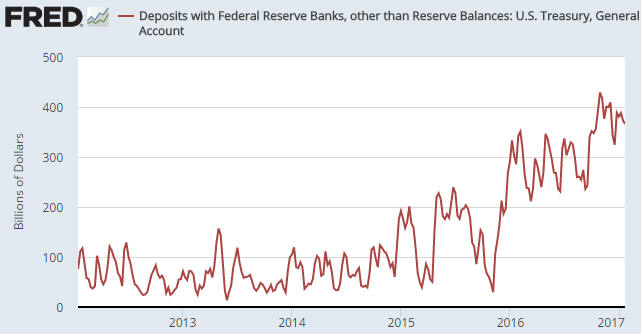
The latest on the US
government's bank account
The Treasury General Account is
the name of the US federal government's bank account at the Fed. The bulk
of the government's income from taxing and borrowing gets cycled through
this account.
Money going into the Treasury General Account is
effectively removed from the economy until it is spent, but prior to the
past 14 months the account itself had minimal economic relevance. This is
because the account balance was always small, with almost all the money
entering the account being spent quickly. Since November-2015, however,
the balance in this account has been large enough and/or has shifted by
enough from month to month to have an influence on the economy and the
stock market.
Our most recent comment on the Treasury General
Account was in the 19th December Weekly Update. At that time there had
just been a 2-week draw-down of $85B (meaning: $85B had just been released
into the financial markets and the economy), which was a little strange.
It was a little strange because a) the main reason for the preceding
build-up in the account was to provide the Treasury with a cash buffer in
case access to the debt market was temporarily shut off, and b) there is a
looming threat that access to the debt market will temporarily be shut off
when the "debt ceiling" comes up for re-negotiation in March-2017.
In attempting to explain what was going on, we hazarded the following
guess:
"...with a Republican moving into the White House and
with the Republican Party in control of both legislative chambers (the
Senate and the House of Representatives), the Obama Administration has
decided to spend whatever money it can before it departs. Having very
little cash in reserve prior to an imminent 'debt ceiling standoff' will
potentially create a substantial problem for the Trump Administration to
deal with. Also, the superficial impression will be created that the
Democrats left the economy in good shape.
The probability that our
guess is correct will increase if the Treasury's General Account continues
to be drawn down prior to Trump's 20th January Inauguration."
Our guess that the Obama Administration was engaged in a last-minute
spending spree appears to have been off-the-mark. As illustrated below,
the balance in the Treasury General Account has since risen from about
$325B to about $365B.
However, it is worth noting that there is a
strong seasonal tendency for the balance in the Treasury's account to rise
during the second half of December and the first half of January. In other
words, it is normal for the money coming into the government to handily
exceed the government's spending between mid-December and mid-January. It
is therefore possible that a last-minute spending spree by the outgoing
administration was masked by the seasonal net in-flow of money. We will
probably never know for sure.
The Stock Market
The US
In mid-December the Dow Industrials Index (Dow) was as 'overbought' on a
short-term basis as it ever gets. Also, sentiment at the time was
dangerously exuberant. This 'overbought/overbullish' situation could have
been resolved via a steep decline, but it was actually resolved via more
than a month of trading sideways within an unusually narrow range. In
fact, the Dow's trading range since mid-December has been narrow enough to
be record-breaking. In percentage terms it is the Dow's narrowest 5-week
range in at least 60 years and possibly ever.
On a short-term basis
the market is no longer 'overbought' and sentiment indicators are now
mixed. It is certainly possible that the market will experience a
post-Inauguration decline (as many pundits are predicting), but another
multi-week surge to the upside is equally probable.
The most
bearish price action would involve a quick rise to well above 20,000
followed within less than two weeks by a decline to well below 20,000.
Elsewhere
The EURO STOXX 50 Index (STOX5E),
the European equivalent of the Dow Industrials Index, broke above the top
of a year-long basing pattern in December. The chart suggests short-term
upside potential to around 3500, while downside risk should be limited by
former resistance (now support) at around 3150.
We suspect that
European equities will handily outperform US equities during 2017 and also
perform well in absolute terms, although if our currency-market outlook is
close to the mark there will be significant stock-market weakness in
Europe from the time of a Q1 high to around the middle of the year.
The Emerging Markets Equity ETF (EEM) rebounded from an early-November
low and has managed to get above resistance at $36, but remains well below
last year's high of around $38. The point we wanted to make/reiterate
today is that there has traditionally been a strong positive correlation
between EEM and broad-based commodity indices such as GNX (the Goldman
Sachs Spot Commodity Index). This correlation is illustrated below.
EEM and GNX have tracked each other less closely than usual over the
past 7 months, but it is still reasonable to expect that a big move to
either the upside or the downside in one will be accompanied by a similar
move in the other.
This week's
significant US economic events
[Notes:
1) The most important events
(to the markets) are shown
in bold. 2) A list of global economic events can be found
HERE]
| Date |
Description |
|
Monday January 23 |
No important events scheduled |
| Tuesday
January 24 |
Existing Home Sales |
|
Wednesday January 25 |
No important events scheduled |
|
Thursday January 26 |
International Trade Balace
New Home Sales
Leading Economic Indicators |
|
Friday January 27 |
Durable Goods Orders
Q4 GDP (preliminary)
Consumer Sentiment |
Gold and the Dollar
Gold
Cycles
Market prices tend to move in
cycles; from very long-term cycles lasting decades to short-term cycles lasting
a few weeks or months. These cycles are often very clear in hindsight --
particularly the ones that last a few years or more -- but putting a lot of
emphasis on cycles in market analyses can create problems. This is because in
real time things regularly don't play out the way that a purely cycles-based
view of the world suggests they should.
A good example of cycles-based
analysis leading to a monumental error is provided by those followers of the
Long Wave, or Kondratyev Wave, who anticipated a collapse in US$-denominated
commodity prices during the first decade of this century based on their belief
that the world was scheduled to experience the "Kondratyev Winter" (a long
period in which commodity prices are supposed to fall). As it turned out,
commodity prices rose sharply. So, either the K-Wave winter ended in 2001 (a
possibility that none of the K-Wave adherents acknowledged at the time), or
didn't begin until 2011, or hasn't yet begun, or is never going to occur because
there is no such thing, or is demonstrating different characteristics to
previous K-Wave winters because this is the first time that this part of the
Long Wave is occurring while none of the national currencies are officially tied
to gold. In other words, even if the K-Wave idea has some merit it can't be
reliably applied to speculating/investing.
Our belief is that cycles are
real and deserve to have a place in our overall market analysis, but that it is
important not to defer to any interpretation of cycles just as it is important
not to be married to any preconceived ideas of what the markets are going to do
in the future. Instead, speculators should be continually developing a thesis
(the thesis is always a work-in-progress because there are no start and finish
points in the markets) by assessing the fundamentals and the price action and,
more generally, by paying attention to what is happening in the world. A review
of cycles could, and probably should, form part of this thesis.
We
generally ignore short-term cycles, because they are more often the result of
randomness than genuine cyclicality. However, we do pay attention to longer-term
cycles that have regularly/reliably timed turning-points in the markets. We
don't assume that the next occurrence of any cycles-predicted turning point will
usher in a reversal, but if a market trends strongly into a cyclical time-window
then our interest will almost certainly be piqued. For example, when the British
Pound collapsed during September-October last year our attention was drawn to
the fact that an 8-year cycle low for this currency was 'due' in early-2017
plus/minus a few months. There is absolutely no guarantee that the Pound's
8-year cycle is going to 'work' this time around, but the fact that the Pound
trended strongly into the turning-point window increases the probability that it
will.
Now that we've explained how we think cycles should fit into the
overall market analysis, let's revisit gold's 8-year cycle. It's appropriate to
do so because the December-2016 low occurred within the turning-point window
predicted by this cycle.
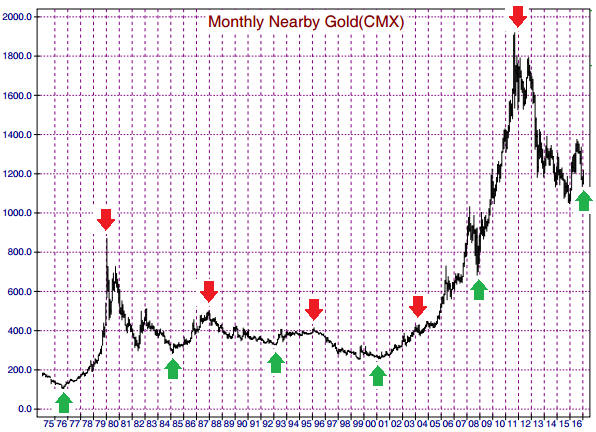
Since the mid-1970s gold has made a cycle low
every 8 years (+/- a couple of months) beginning in 1977 and a cycle high every
8 years (+/- a couple of months) beginning in 1980. A monthly chart on which the
8-year cycle lows are indicated by upward-pointing green arrows and the 8-year
cycle highs are indicated by downward-pointing red arrows is displayed below.
The last two 8-year cycle lows were in early-2001 and late-2008, so the next
one was/is due in late-2016 or early-2017. With the gold price having turned
upward in December following a steep multi-month decline it is certainly
possible that the 8-year cycle has just timed another important bottom.
The 8-year cycle makes no prediction regarding the magnitude of the rally
following a cycle low. For example, the cycle low in late-1976 was followed by a
3-year rally of more than 700% whereas the cycle low in early-1993 was followed
by a 3-year rally of only 29%. The cycle's only predictions are that the cycle
low should hold for at least a few years and be followed about three years later
by an 8-year cycle high.
Current Market
Situation
The idea that an 8-year cycle low was put in place in
December conflicts with our view that the US$ gold price will probably undercut
its December-2016 low in the second or third quarters of this year. However,
this conflict is not a problem, because:
1) At this stage we don't know
for sure that an 8-year cycle low is in place. For instance, similar to the way
the 8-year cycle high that was due in early-2012 occurred a few months earlier
than the predicted time, the 8-year cycle low due about now could occur a few
months later than the predicted time.
2) For reasons that have nothing to
do with cycles we anticipated a strong rebound in the gold price from its
December-2016 low.
3) If the December-2016 low is destined to be
longer-lasting than we currently expect then a pronounced fundamental shift in
gold's favour should become evident within the next few months. The new
information would prompt a change in our view with no harm done (since we would
have participated in the initial rally from the low).
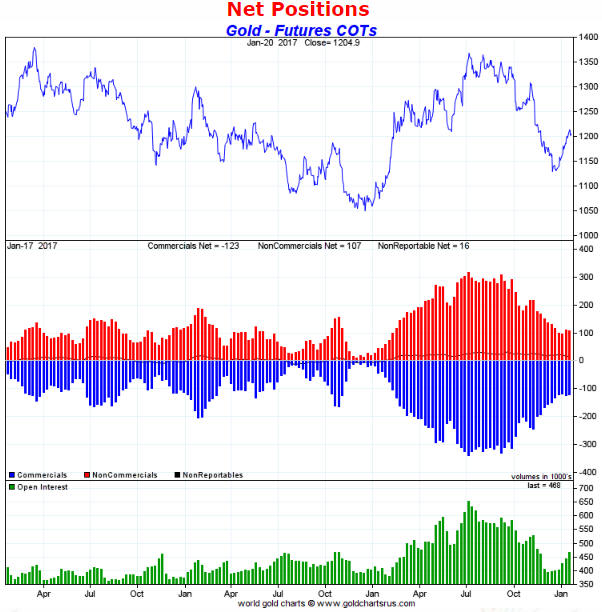
Gold's Commitments
of Traders (COT) situation is worth highlighting today, mainly because it hardly
changed at all during the rebound of the past few weeks. The relevant chart is
displayed below. In other words, the net position of speculators in Comex gold
futures is roughly the same now, with the gold price in the low-$1200s, as it
was when the gold price was bottoming in the $1120s last month. This is both
unusual and unequivocally bullish. It is bullish because it means that the gold
price has managed to gain about $80/ounce without consuming any
speculative-buying fuel.
Also worth highlighting is that the current rebound has differentiated
itself from the preceding rebound (the rebound from the early-October low) by
not reversing downward immediately after reaching the 50-day MA.
With gold's rebound from its December bottom having reached the lower end of our
target range (the low-$1200s) without using-up any speculative fuel and with
inter-related markets poised to remain supportive for gold in the short-term,
there is now a good chance that the gold price will reach the upper end of our
target range before making a top that holds for more than 2-3 weeks. The upper
end of our target range is defined by the 200-day MA, which is presently near
$1270.
An intervening correction should find support near the 50-day MA,
which is presently in the low-$1180s.
Gold Stocks
On a very short-term basis the gold-mining sector is out of synch with the
bullion market. Whereas the US$ gold price trended upward to some sort of peak
on 17th January, the HUI has been in consolidation mode since 5th January. This
is notable, but not unusual.
We
suspect that the gold-mining sector's consolidation will end this week, but
before it ends there could be a decline to near the HUI's 50-day MA in the
mid-180s. It would be reasonable for short-term traders to view such a decline
as a buying opportunity.
The 200-day MA near 220 continues to be the
bottom of our target range for the HUI's short-term rally, although it is
becoming increasingly likely that the rally will end closer to the top than the
bottom of this range (the top of the range is 250). One reason is the evidence
that the gold price is headed for the top of its own target range. Another
reason is that some gold-mining indices and ETFs have already reached their
200-day MAs. For example, in last week's Interim Update we included a chart
showing that the XAU had reached its 200-day MA. For another example, the
following chart shows that GDXJ has tested its 200-day MA several times over the
past two weeks.
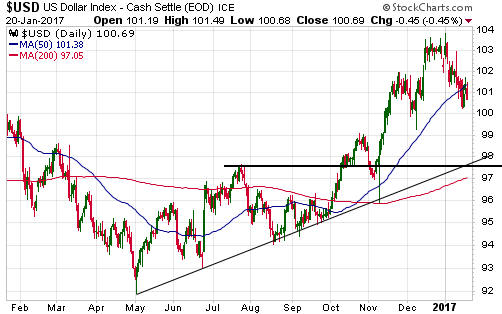
The Currency Market
The downward correction in the
Dollar Index continued over the past week and probably isn't complete. We'll
take the evidence as it comes, but at this stage we expect to see the Dollar
Index in the high-90s prior to the start of the next multi-month US$ rally.
Critical support for the Dollar Index lies at 97.5. This is as far as the
dollar could fall while leaving its intermediate-term upward trend intact.
The British Pound and the Japanese Yen are the major currencies with the
most bullish Commitments of Traders (COT) situations. We discussed the Pound at
length in last week's Interim Update, so we'll now turn our attention to the
Yen.
As mentioned many times in the past, the Yen is the currency that
has the strongest correlation with the gold price. The correlation is clearly
illustrated by the following chart. It therefore isn't surprising that the
rebound in the gold price from a mid-December low has gone hand-in-hand with a
rebound in the Yen. Furthermore, evidence (mainly in the form of the COT data)
that the Yen's rebound is not complete supports the short-term bullish case for
gold, and evidence (in the form of the bond/dollar ratio and the COT data) that
gold's rebound is not complete supports the short-term bullish case for the Yen.
Zooming-in on the Yen's recent price action, we have a bounce from an
'oversold' extreme to the 50-day MA and then a pullback. This is normal for the
first phase of a larger rally.
It can take time for confidence to build
in the sustainability of a rally, with speculators initially being hesitant to
'go long' and each step forward being followed by half a step backward. That's
the case right now with the Yen. When the Yen bottomed in December, speculators
had a large net-short position in Yen futures. Despite the rebound of the past
few weeks the speculative net-short position has hardly changed at all, which
from a contrarian perspective is bullish.
We
expect to see the Yen in the 90s before the end of this quarter.
Updates
on Stock Selections
Notes: 1) To review the complete list of current TSI stock selections, logon at
http://www.speculative-investor.com/new/market_logon.asp
and then click on "Stock Selections" in the menu. When at the Stock
Selections page, click on a stock's symbol to bring-up an archive of
our comments on the stock in question. 2) The Small Stock Watch List is
located at http://www.speculative-investor.com/new/smallstockwatch.html
 Company
news/developments for the week ending Friday 20th January 2017:
Company
news/developments for the week ending Friday 20th January 2017:
[Note: AISC = All-In Sustaining Cost, FS = Feasibility Study, FY = Financial
Year, IRR = Internal Rate of Return, ISR = In-Situ Recovery, MD&A = Management
Discussion and Analysis, M&I = Measured and Indicated, NAV = Net Asset Value,
NPV(X%) = Net Present Value using a discount rate of X%, P&P = Proven and
Probable, PEA = Preliminary Economic Assessment, PFS = Pre-Feasibility Study]
*Just in case it isn't already well known we point out that
Evolution Mining (EVN.AX), via two deals that were done at opportune
times last year, has exposure to copper in addition to gold. First, EVN has
current copper production of around 45M pounds/year thanks to its agreement,
last August, to buy a stake in Glencore's Ernest Henry copper-gold mine. The
copper production will be accounted for as a byproduct of the acquired gold
production, which means that copper sales revenue will be deducted from the cost
line rather than added to the revenue line. A rise in the copper price therefore
reduces the reported gold-production cost. Second, EVN added a 1.5B-pound copper
resource to its portfolio via the purchase, last October, of the Marsden
copper-gold project from Newcrest Mining.
This constitutes unlevered,
low-risk exposure to copper.
*Taseko Mines (TGB)
announced an improvement in the estimated economics of its development-stage
Florence copper project in Arizona. Assuming a long-term copper price of
$3/pound, the estimated pre-tax NPV(7.5%) and IRR have increased from US$850M
and 39% to US$920M and 44%, respectively. The earlier numbers were part of a
PFS completed in 2013.
The improvement is good news, but it is
annoying that the company chose to report PRE-tax economics and assumed a copper
price that's almost 20% above the current spot price. Unless the company has
figured out a way to avoid tax, reporting the project economics excluding tax
makes about as much sense as reporting the project economics excluding materials
or energy or any other major cost.
What we are interested in are the
POST-tax project economics at a range of prices that span the current spot
price. Based on information in the 2013 PFS, the Florence project appears to be
economically robust at $2.50/pound and might still be viable at $2.25/pound.
TGB provides highly-levered, relatively-high-risk exposure to copper.
*UEX Corp. (UEX.TO) is raising C$6M by issuing
non-flow-through shares at C$0.25 and flow-through shares at C$0.30. The total
number of new shares is expected to be about 16M.
As an
exploration-stage uranium miner with no revenue, UEX must regularly issue new
shares to fund its business. The new shares reduce the company's per-share value
when they are issued at depressed prices (despite having rebounded strongly with
most other uranium stocks over the past couple of months, UEX's stock price can
still be classed as "depressed"), but it has to be done.
List
of candidates for new buying
From within the ranks of TSI stock
selections the best candidates for new buying at this time, listed in
alphabetical order, are:
1) AAU at around US$0.90 (last Friday's closing
price: US$1.00)
2) ALK.AX at A$0.35 or lower (last Friday's closing
price: A$0.37)
3) ESM.TO (last Friday's closing price: C$0.83)
4)
SCP.TO (last Friday's closing price: C$0.54) or ADI.V (last Friday's closing
price: C$0.19). Note that these companies are merging and that -- due to the
warrants to be received by ADI shareholders as part of the merger -- fair value
for ADI is slightly more than one-third the price of SCP. For example, with SCP
at C$0.54, fair value for ADI would be about C$0.19.
The above list is
limited to five stocks. It will sometimes contain less than five, but it will
never contain more than five regardless of how many stocks are attractively
priced for new buying.
Chart Sources
Charts appearing in today's commentary
are courtesy of:
http://stockcharts.com/index.html
http://www.mrci.com/
http://www.goldchartsrus.com/
http://research.stlouisfed.org/
