|
-- for the Week Commencing 23rd September 2002
Forecast
Summary
 The
Latest Forecast Summary (no change from last week) The
Latest Forecast Summary (no change from last week)
Big Picture
View
Here is a summary of our big picture
view of the markets. Note that our short-term views may differ from our
big picture view.
Bond yields (long-term interest
rates) will move higher during 2002.
The US stock market will reach
a major bottom (well below the July-2002 lows) during the second half of
2003.
The Dollar commenced a bear
market in July 2001 and will continue its decline into 2003.
A bull market in gold stocks
commenced in November 2000 and is likely to extend into 2003.
Commodity prices, as represented
by the CRB Index, will rally during 2002 and 2003.
Commodities
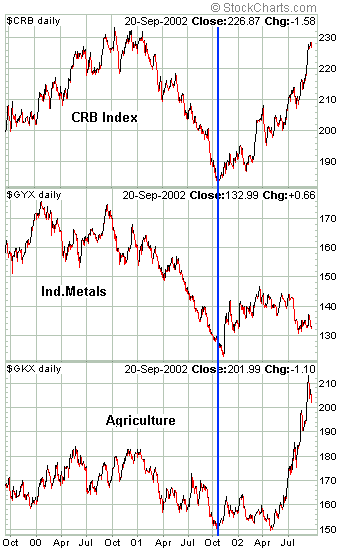
Commodity prices, as represented by
the CRB Index, have moved up to near a 4-year high. Most of the recent
increase in the CRB Index can be explained by the sharp rallies in the
oil price and in the prices of agricultural commodities. These price rises
can, in turn, be explained by factors affecting supply, such as the much-anticipated
war against Iraq and the terrible drought conditions that have adversely
impacted this year's crops. Other commodities, such as the industrial metals,
have not experienced much of a rise. The following chart shows the CRB
Index and the marked difference in the performances of the industrial metals
and the agricultural commodities over the past few months.

Because the recent gains in the CRB
Index can be explained by supply-related factors, the commodity rally is
not currently being seen as an effect of inflation. Analysts who mistakenly
think of inflation in terms of increases in the consumer and producer price
indices have certainly been quick to come to this conclusion. At this stage,
however, it looks to us like the world is in the early stages of an inflation-driven
commodity bull market, although we will need to see a rally in industrial
metals prices to confirm this view.
One reason there might be more to this
commodity rally than most people think is that the rally is consistent
with what is happening in the currency and gold markets (the rally began
after the gold price turned higher and accelerated after the US$ began
to have problems, as was the case in the early 1970s). It is, of course,
also consistent with last year's explosive growth in the money supply.
Another reason is that the rally in the oil price over the past 12 months
looks much more like the first leg in a bull market than simply a war-related
spike.
Governments have aggressively promoted
the "CPI = inflation" concept over the past 50 years (with great success,
we might add) because as long as inflation is defined as an increase in
consumer prices then the inflation can always be blamed on droughts, foreign
oil cartels, speculators, militant unions, anything except the government
and the central bank. It is important to understand, however, that a rise
in the price of any one commodity, including one as important as oil, or
even a rise in the price of any group of commodities, cannot cause
an increase in the general price level. If the supply of money is fixed
or is only increasing at the rate at which economic output is growing,
then a rise in price somewhere in the economy must be offset by a fall
in price somewhere else. However, if the Fed facilitates a sufficient increase
in the money supply then a rise in one group of prices does not have to
force other prices lower.
As things currently stand, industrial
metals prices (as represented by the commodity index shown on the above
chart) are essentially flat since the beginning of the year and are still
about 10% above last year's low. In our opinion, the ability of some commodities
to simply hold their ground while the prices of other commodities surge
is evidence that inflation is having a significant effect on the commodity
market.
By the way, the ratio of the Amex Oil
Index and the oil price has now reached a level that has, in the past,
been associated with intermediate-term peaks in the oil price. We are probably
very close to a peak in the oil price that will stand for at least 3-6
months.
Bonds
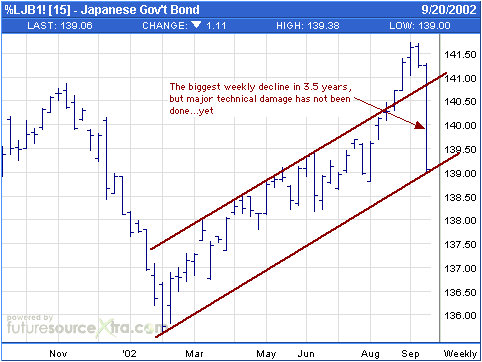
The Japanese bond market appears to
be leading the US bond market so we are watching the JGBs (Japanese Government
Bonds) closely for signs of a peak. Last week's fall in JGBs was the biggest
in 3.5 years, but the medium-term channel was not broken (see chart below).
A weekly close below 138.50 would be a decisive break of the up-trend and
a sign that bonds have peaked.

The US
Stock Market
A new 'canary in the mine'
Way back in October of 2000 we gave
B2B software company Ariba (ARBA) the distinction of being our 'canary
in the mine' as far as speculative excesses in the stock market were concerned.
(For those who can't remember the internet mania, B2B stands for "business
to business". As recently as 2 years ago it was thought to represent a
mulit-trillion dollar opportunity). At that time ARBA was trading at around
$140/share. It was losing money at a phenomenal pace and didn't appear
to have much hope of ever generating much in the way of profits, yet the
market was valuing the company at around US$40B. We figured it was worth
less than $10/share and argued that when ARBA traded below $10 it would
be a sign that most of the speculative excesses had been removed from the
market. As it turned out, we were way too bullish. ARBA closed at $1.59
on Friday and a lot of speculative excess remains. We therefore need a
new canary.
Over the past 2 years the stocks of
the small companies that soared to ridiculous heights during the manic
period of 1998-2000 have, in general, been trashed. Most of these companies
have now either disappeared or are trading at low multiples of sales. In
fact, in many cases they are trading at, or below, their cash levels. In
this respect, therefore, the excesses have been removed from the market.
However, several of the large-cap leaders of the previous bull market still
sell at ludicrously high multiples of sales and profits. We doubt that
the bear will have finished its work until these former darlings are reasonably
priced.
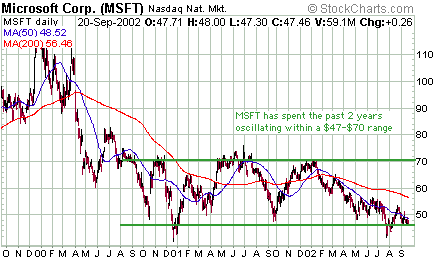
Chief amongst these former darlings
is Microsoft (MSFT). Due to its incredibly strong balance sheet MSFT has
been considered a safe haven and has essentially traded sideways over the
past 2 years (see chart below). Safe haven or not, as long as investors
are prepared to pay 9-times sales and 33-times earnings for a slow-growing,
non-dividend-paying technology bellwether such as MSFT, we can be confident
that sentiment remains overly bullish and the bear market is not over.
MSFT closed at $47.46 on Friday, near the bottom of its range. We think
fair value for this stock is around $25 and expect fair value (or lower)
to be achieved before the bear market ends.

Current Market Situation
Over the past several weeks our expectation
has been that the stock indices would rebound back to, or above, their
August highs before the next major downward leg in the bear market got
underway. This remains the case. In fact, although last week's stock market
action could be described as downright ugly, it was encouraging (as far
as our forecast for another rebound is concerned) that the level of fear
rose much more than the stock indices fell. For example, the S&P500
Index dropped by only 5% last week and remains above both its July low
and its August low, yet the 5-day moving-average of the equity put/call
ratio just hit its highest level in many years (our records don't go back
that far, but it is likely that the 5-DMA of the equity put/call ratio
just reached its highest level since the 1987 stock market crash). As another
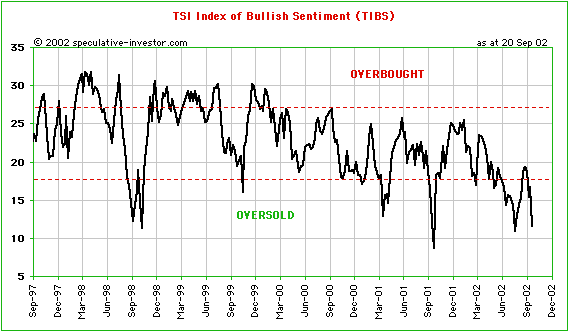
example of the extreme fear in the market, the TSI Index of Bullish Sentiment
has moved down to near its July lows (see chart below) and would probably
have fallen to new lows except that some of the inputs to this index (the
sentiment surveys) don't yet reflect the effects of last week's stock market
action.

Last week's sharp increase in fear
reduces the probability that the stock indices will plunge well below their
July lows without first putting together another substantial rebound, although
an October-1998-style intra-day spike below the July lows in the NASDAQ100
Index and/or the Dow Industrials Index would not surprise us given the
power of the short-term downtrends and the capitulation that is now taking
place.
In terms of market sentiment our only
concern at this time is that the NASDAQ100 Volatility Index (VXN) remains
well below the peaks reached in July-2002, September-2001 and April-2001.
The VXN closed at 59 on Friday and until it moves up to at least 75 we
will be very cautious with regard to any new buying.
We will continue to offer our Dow March-2003
$76 put options for sale at $7.00. Unless the Dow drops to near its July
low the puts won't trade that high, but we are in no hurry to sell. In
time, the Dow will trade well below the July low. The only reason we are
attempting to take any profits now is that the extremes of fearfulness
that are currently being seen suggest that a powerful rebound will occur
in the near future, particularly if we get a sharp upward spike in volatility
over the next 2 days.
Lastly, the FOMC meets again on Tuesday.
We will be surprised, to say the least, if the Fed cuts interest rates
at this meeting. This is because a) the effects of inflation are starting
to be seen in all the wrong places, b) a rate cut might spook the bond
market, and c) another 25 or 50 basis point reduction in the Fed Funds
Rate has no chance of having anything more than a fleeting effect on the
stock market.
This week's important economic/market
events
| Date |
Description |
| Monday September 23 |
Leading Economic Indicators |
| Tuesday September 24 |
FOMC Meeting
Consumer Confidence |
| Wednesday September 25 |
Existing Home Sales |
| Thursday September 26 |
Durable Goods Orders
New Home Sales |
| Friday September 27 |
Q2 GDP |
 Click
here to read the rest of today's commentary Click
here to read the rest of today's commentary

|

