|
-- Weekly Market Update for the Week Commencing 24th March 2003
Forecast
Summary
 The
Latest Forecast Summary The
Latest Forecast Summary
Big Picture
View
Here is a summary of our big picture
view of the markets. Note that our short-term views may differ from our
big picture view.
Bond yields (long-term interest
rates) will move below their 2002 lows during the first half of 2003.
The US stock market will move
well below the October-2002 low during 2003, but a major bottom won't occur
until 2004.
The Dollar commenced a bear
market in July 2001 and will continue its decline during 2003 and 2004.
A bull market in gold stocks
commenced in November 2000 and will continue during 2003 and 2004.
Commodity prices, as represented
by the CRB Index, will rally during 2003 and 2004 with most of the upside
occurring in 2004.
Commodities
In the 19th February Interim Update
we reviewed the ratio of oil stocks (as represented by the XOI) and the
oil price and concluded that the stock market was valuing oil stocks on
the basis that the oil price was going to drop to around $23. We also said
that:
a) While there was clearly a large
'supply shock' premium built into the oil market we doubted that the oil
price would make a sustained move back to the low 20s. As such,
the stock market appeared to be overly pessimistic with regard to the prospects
for oil stocks over the next 1-2 years.
b) Longer-term investors would potentially
be presented with an excellent buying opportunity in oil stocks when the
Iraq situation was perceived to have been resolved.
The oil price has subsequently fallen
from $36 to $26 (NYMEX crude oil for April delivery closed at $26.91 last
Friday) while the XOI has edged up to 432. The stock market now appears
to be discounting an oil price of $24, so the huge divergence between the
stock and commodity markets that existed a few weeks ago has almost been
eliminated. The oil price probably has additional downside risk of about
10% over the next few months, but this is no greater than the upside risk.
As such, we are no longer short-term bearish on oil.
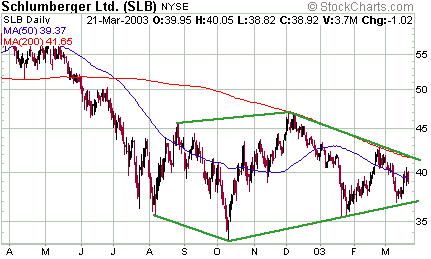
By the way, the stock price of Schlumberger
(NYSE: SLB), one of the world's largest providers of services to the oil
industry, is tracing out a pattern that is either a major bottom or a consolidation
prior to a massive decline. In other words, the direction of the next breakout
will be very important.
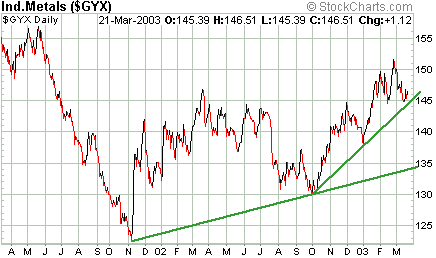
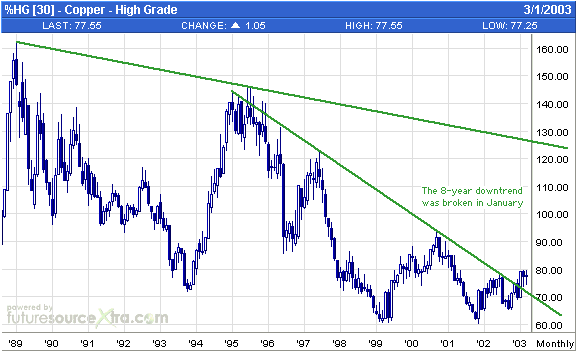
Below is a 2-year chart showing an
index of industrial metals (copper, aluminium, nickel, lead, zinc and tin).
We are bullish on the industrial metals and are particularly bullish on
copper as far as the next 2 years are concerned (a long-term monthly copper
chart is also shown below).
The US
Stock Market
Stocks and bonds
Anyone who has been paying the slightest
amount of attention to what has been happening in the financial markets
over the past few years would certainly realise that the US stock market
has been moving in the same direction as long-term interest rates. This
relationship is not 'normal' (in a 'normal' environment the stock market
rises when interest rates fall), but it has dominated the financial landscape
since 1998 and is very much still in effect.
Below is a chart comparison of the
S&P500 Index and the yield on the 30-year T-Bond since the beginning
of 2001. The chart shows that each decline by the S&P500 to a new bear-market
low has been accompanied by a drop to a new low by the bond yield. It also
shows that the three largest rallies in the stock market during this period
(labeled A, B and C) have been accompanied by surges in the bond yield
and that another sharp rise in the bond yield has accompanied the latest
stock market rally (labeled D).
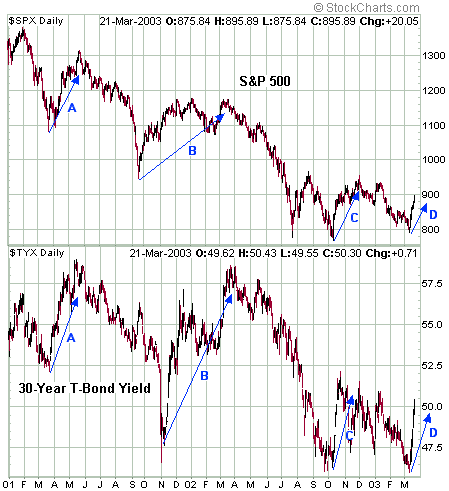
Based on the relationship between stocks
and interest rates that has been in force since 1998, the sharp rise in
long-term interest rates over the past 2 weeks is a bullish sign for the
stock market. In effect, it confirms the stock market's rally. (Note that
the July-August rally last year, a rally that was not confirmed by a surge
in the bond yield, failed after only a few weeks and was quickly followed
by a drop to a new bear-market low.) It is only a bullish sign, however,
in the context of an on-going major bear market. In other words, the current
rally is following exactly the same pattern as every other rally that has
occurred since the bear market began. The interest rate 'confirmation'
of the rally simply suggests that a drop to a new bear market low is probably
a few months away.
During the bear market (the bear market
began in 1998 for the average stock and 2000 for the major stock indices),
interest rates have always bottomed at around the same time that stocks
were making important lows and have then moved higher as stocks rallied.
However, as explained in prior commentaries over the past 2 years, major
bottoms in the stock market only occur after interest rates have reached
an important peak. In fact, even during the deflationary 1930s the
stock market did not reach its ultimate low until after bond prices
collapsed (interest rates peaked). So, before the stock market reaches
a long-term bottom and before a new bull market can commence we
should expect to see large concurrent declines in stocks and bonds as money
flees all financial assets.
The stock market, the A$ and the
euro
Early this year we pointed out that
the euro/A$ exchange rate (the number of euros per Australian Dollar) tends
to move in the same direction as the US stock market. This is not as strange
as it might first appear since the A$ tends to be more of a 'growth' currency
than the euro. As such, it often out-performs during those periods when
investors are becoming more optimistic about the prospects for economic
growth and under-performs when growth expectations are being reduced. The
stock market, of course, will also tend to perform better when optimism
is rising.
The below chart compares the S&P500
with the euros-per-A$ rate since the beginning of 2001 (the line on the
euro/A$ chart rises when the A$ is out-performing the euro). The chart
clearly shows a positive correlation between the two markets. It also shows
that both markets have essentially traded sideways since bottoming together
last July. An extension of the latest stock market rally would give the
A$ a boost relative to the euro, but once we get some evidence that the
next major decline in the stock market is underway it will be time to look
for the A$ to start under-performing the euro. Interestingly, the euro/A$
exchange rate was near the 0.61 level at both the May-2001 and March-2002
peaks in the stock market.
The story thus far
Over the past two months we've forecast
that an important low for the US stock market would be in place by the
end of March. Furthermore, by late February it had become apparent to us
that this low would not be substantially below the October-2002 low. As
such, we suggested that bearish positions be exited if the S&P500 Index
traded below 790.
On 12th March the S&P500 spiked
below 790, taking us out of QQQ put options.
In the 12th March Interim Update we
emphasised that the March low we had been anticipating would not be substantially
below current levels (the S&P500 was trading at 804 at the time) and
noted that the price action within the tech sector suggested there was
more upside risk than downside risk over the next 4-6 weeks.
In the Weekly Market Update posted
on 16th March we said that a 1-2 month rally had probably begun. Our opinion
was that longer-term investors should continue to remain out of the general
market, but that traders could attempt to 'play' the rally via call options
or via some of the beaten down tech stocks. We added some Alcoa call options
to the TSI Stocks List to reflect this view.
In the Interim Update posted last Thursday
morning we said that the initial leg of the rally would probably be complete
by 21st March and that the rally would, at best, ultimately result in the
major stock indices trading about 10% above last Wednesday's closing levels
(that is, about 9,000 for the Dow and 1550 for the NASDAQ Composite).
Current Market Situation
Both the S&P500 Index and the Dow
Industrials Index are within about 5% of what will likely prove to be insurmountable
resistance (930-950 for the S&P500 and 9,000 for the Dow). At the same
time, in terms of overbought/oversold indicators some of the things we
expected to see prior to the current rally reaching its ultimate peak have
already occurred. For example:
a) The 5-day moving average of the
equity put/call ratio has dropped to 0.53 (its lowest level since last
August).
b) The McClellan Oscillator has risen
to near its highest levels of the past year
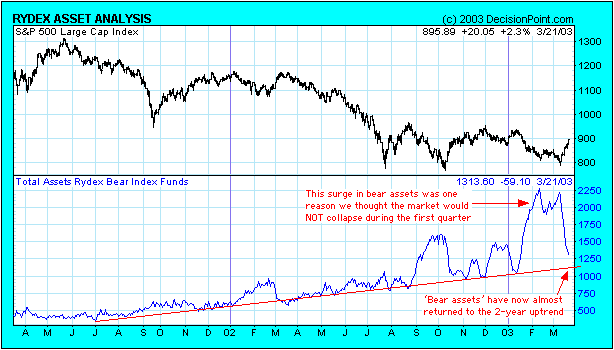
c) There has been a plunge in the total
assets in Rydex Bear Index Funds (see chart below). In fact, the 8-day
stock market rally has brought this indicator back to its 2-year trend-line.
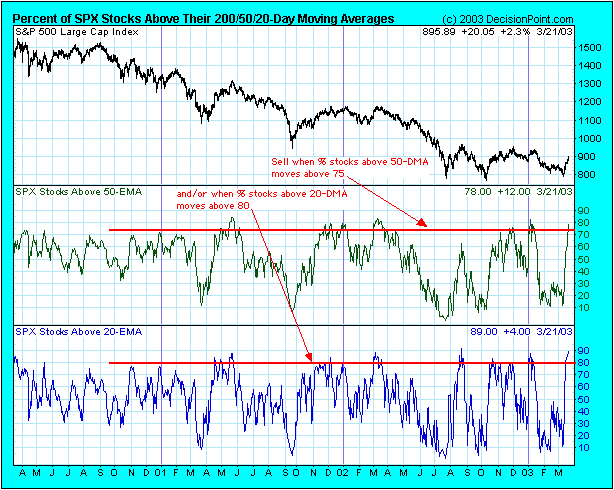
d) The percentages of S&P500 stocks
above their 50-day and 20-day moving averages are now at levels that have,
over the past 2 years, been associated with important peaks in the market
(see chart below).
At the beginning of a new bull market
it would be normal for the stock indices to ignore 'overbought' readings
and to push relentlessly higher. However, we don't think there is any real
chance that a new bull market has begun. Apart from the valuation problem
and the fact that sentiment never became anywhere near as bearish as it
has near previous bear market bottoms, consumers and businesses are being
weighed down by huge debt burdens and the Fed has already used up almost
all of its interest rate ammunition. As such, most of the upside risk in
the market has probably been removed by the recent rally.
Although we don't expect the market
to make further substantial upward progress, we are not enthusiastic about
re-establishing bearish positions at this time. There are two reasons for
this. Firstly, most bear-market rallies occur in three stages with an initial
upward leg, a pullback, and then a final push to the ultimate rally peak.
Therefore, there will probably be one final surge to a new recovery high
following the next pullback. The final high might not be far above last
Friday's closing level, but the process of pulling back and then rallying
to a new high could potentially add several weeks to the entire advance.
This is an important consideration for any trader planning to use put options
to profit from the next major downturn. Secondly, until the war against
Iraq comes to an end the market will be subject to both positive and negative
war-related 'shocks' on almost a daily basis. For example, the market currently
appears to be discounting a quick and easy US victory, so when something
goes wrong (and something WILL go wrong) there will be a swift drop in
stock prices. Conversely, if things go even better than expected, for example,
if Saddam is overthrown and the new leadership starts negotiating a peace
treaty with the US, then the stock indices could gain 5% or more in the
blink of an eye. In other words, until the focus begins to shift away from
Iraq and back to the problems that caused the bear market in the first
place the best approach will probably be to stay out of harm's way.
By the way, another reason to be wary
of committing money to bearish positions at this time is that the commercial
net-short position in S&P500 futures has fallen to its lowest level
in almost 3 years (as at 18th March the commercial net-short position was
only 7,000 contracts). Significantly, the 65-point gain in the S&P500
Index between 11th March and 18th March was accompanied by a 38,000-contract
reduction in the net-short position of the commercial traders and a 36,000-contract
reduction in the net-long position of the small traders. In other words,
the 'smart money' bought during the early stages of the rally while
the 'dumb money' sold.
This week's important economic/market
events
| Date |
Description |
| Monday March 17 |
No significant events |
| Tuesday March 18 |
Existing Home Sales
Consumer Confidence |
| Wednesday March 19 |
Durable Goods Orders
New Home Sales |
| Thursday March 20 |
Q4 GDP |
| Friday March 21 |
Personal Income and Expenditure |
Click
here to read the rest of today's commentary

|
