|
-- for the Week Commencing 26th November 2001
Forecast
Summary
 The
Latest Forecast Summary The
Latest Forecast Summary
Big Picture
View
Here is a summary of our big picture
view of the markets. Note that our short-term views may differ from our
big picture view.
Bond yields (long-term interest
rates) will move higher into 2002.
The US stock market will rally
into the first half of 2002, but will subsequently make new bear market
lows.
The Dollar commenced a bear
market in July 2001, but will rally to a secondary peak during the first
half of 2002 before beginning a major descent.
A bull market in gold stocks
commenced in November 2000 and is likely to extend into 2003.
Commodity prices, as represented
by the CRB Index, are in the process of bottoming. The CRB Index will reverse
higher by the first quarter of 2002 (at the latest) and then rally over
the ensuing 1-2 years.
The oil price will resume its
major uptrend during the first half of 2002.
The 'Real'
Real Interest Rate
The Economic Cycle Research Institute
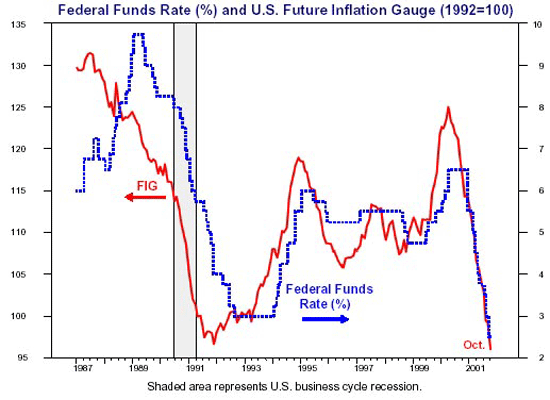
(ECRI) calculates a Future Inflation Gauge (FIG) each month. As its name
suggests the FIG was designed to predict changes in the inflation rate
with a lead-time of several months. However, neither the money supply growth
rate nor the single most important influence on the money supply growth
rate - changes in the level of long-term interest rates - are considered
when calculating the FIG. It is therefore not a good leading indicator
of inflation (a list of the FIG's components can be found at http://www.dismal.com/dismal/dsp/release_def.asp?r=usa_ecrifig).
As the following chart shows it has, however, been an excellent leading
indicator of Fed policy during Greenspan's tenure as Fed Chairman. In our
opinion the FIG should be re-named the FGG - Future Greenspan Gauge.
Since 1934 the US has experienced inflation,
and only inflation, in varying degrees. During those times when the inflation
has manifested itself in the prices of commodities and the widely-watched
(and manipulated far beyond the point of usefulness) price indices, the
inflation was perceived to be a problem. During those times when the inflation
was only evident in the trade deficit and/or asset prices, the inflation
wasn't perceived to be a problem. In fact it wasn't (isn't) perceived at
all.
Our view of inflation/deflation - that
inflation is an increase in the money supply and deflation is a decrease
in the money supply - may appear to be overly simplistic. However, it is
only by starting with the premise that inflation/deflation relate purely
to what is happening with the supply of money that One can make sense of
what has happened over the past decade.
Asset price bubbles can only occur
when the real rate of interest (the nominal interest rate minus the inflation
rate) is extremely low. However, during 1996-1999 anyone who calculated
the real interest rate by subtracting the CPI from the nominal interest
rate would not have perceived that real interest rates were unusually low.
They would therefore, in all likelihood, have found the need to resort
to "new era" and "new economy" fantasies in order to explain the asset
price explosion. For those who understood the true meaning of inflation
the explanation was far more logical - negative real interest rates propelled
a massive expansion of credit that, in turn, pushed asset prices and the
trade deficit into the stratosphere.
Below are two charts that illustrate
our point. The first chart shows the real Fed Funds Rate calculated by
subtracting the year-over-year change in M2 money supply from the Fed Funds
Rate (let's call this the 'real' real interest rate). Note that the 'real'
real interest rate peaked in early 1995 at 6%, went decisively negative
in late-1997 and didn't turn positive again until the first half of 2000.
Recall what happened to the stock market when the 'real' real interest
rate poked its head above zero last year. The second chart shows the real
Fed Funds Rate calculated by subtracting the annualised percentage change
in the median CPI from the Fed Funds Rate and represents the consensus
view of the real interest rate. (The median CPI, calculated monthly by
the Cleveland Fed, is the best official measure of consumer price changes
because any outlying values are excluded from its calculation. For example,
if tobacco prices spike higher and computer prices spike lower during a
particular month then both will be excluded from that month's calculation.)
Note that this real interest rate remained stable in the +2.5% to +3.5%
range throughout the course of the asset price bubble.
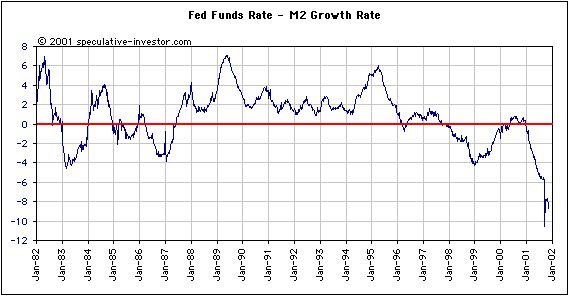
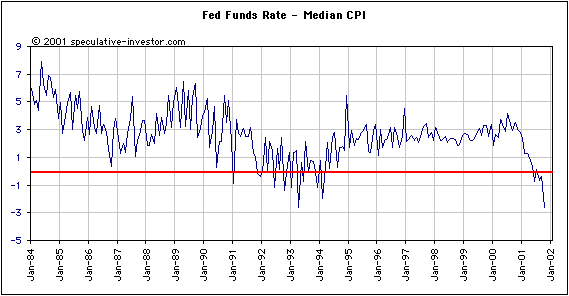
The above charts also confirm that
both the real interest rate and the 'real' real interest rate are now extremely
low (deeply into negative territory). The conditions are currently very
much in place for another bubble with the big question being where
the next bubble will appear.
The US is presently experiencing an
extremely high inflation rate and extremely low real interest rates, yet
the Future Greenspan Gauge tells us not to expect any change in Fed policy
for at least a few more months. This means the inflation problem is going
to get much worse.
The US
Stock Market
Stocks and Bonds
First, a quick re-cap. There are two
reasons why we don't think the final bear market lows have been seen. The
first reason is that important stock market bottoms tend to follow closely
behind important peaks in long-term interest rates. However, what we have
seen since March-2000 is simply a continuation of the topsy-turvy world
of a credit bubble, where stocks and interest rates spend most their time
trending in the same direction. The second reason is that we expect long-term
interest rates to rise over the next several months as the market discounts
the effects of this year's massive monetary inflation. However, the high
price-earnings ratios of many large-cap stocks are incompatible with higher
interest rates.
Now, let's take a look at bonds (a
weekly chart of T-Bond futures is included below). The 30-year T-Bond price
peaked on November 1st, but we can make a pretty good case that the real
peak in the bond market occurred in March and that the late-October/early-November
surge was a false breakout. A March peak in bonds makes sense on the basis
that:
a) Since 1993 bonds have generally
trended strongly in one direction for 12-15 months before reversing and
trending in the opposite direction for 12-15 months. With bonds having
bottomed in January of 2000 this cyclical behaviour had pointed to the
January-April period this year as a likely time for a peak.
b) Unlike the March peak, the November
peak was not confirmed by new lows in the A$ (with the exception of November
this year, every important bond market peak of the past 15 years has occurred
at the same time as, or just after, a bottom for the A$).
c) The Dow Utilities Index, which
tends to move with or slightly in advance of bonds, peaked at the end of
last year.
d) The collapse in bond prices over
the past 2 weeks suggests that the break above the March high was artificial
and, therefore, unsustainable.
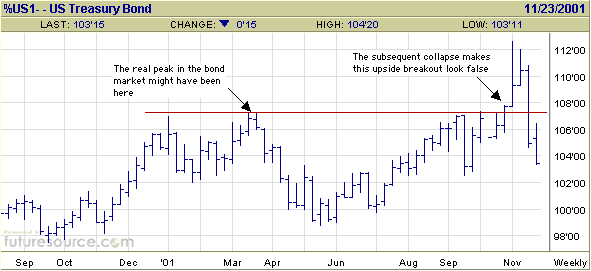
If March was the real bond market peak
then a continuation of the 12-15 month cycle would point to the March-June
period next year as the most likely time for bonds to bottom.
If the markets continue to behave as
they have done for the past few years then the stock indices will rally
in parallel with a rising trend in interest rates and reach a peak at around
the time that interest rates are peaking (bonds are bottoming). So, based
on the above bond market discussion the March-June period next year becomes
a likely time for this stock market rally's ultimate peak.
The above is a thesis that will need
to be validated by price action every step of the way. At this stage it
makes sense based on what we know and what we are observing. For example,
stocks initially rallied from their September-21 panic lows in parallel
with rising bond prices (falling interest rates), but the bubble trend
(stocks and bonds trending in opposite directions) now appears to be re-asserting
itself. Furthermore, although sentiment indicators suggest we are close
to a short-term peak, they do not suggest that we are nearing the ultimate
peak of this rally.
Current Market Situation
Stock indices peaked last Monday and
moved up to test Monday's highs during Friday's half-day session. Friday's
rally, although on light volume as would be expected on the day following
Thanksgiving, was broad-based and hinted that a push above last Monday's
highs will occur during the next few days before we see any meaningful
downside. However, sentiment indicators are now uniform in their message
that the rally will soon run out of steam.
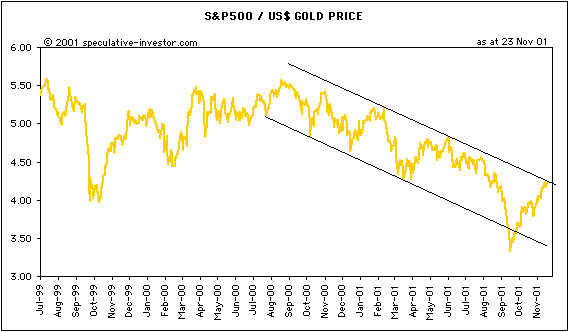
The following chart showing the number
of ounces of gold it takes to buy the S&P500 Index also suggests that
we are very close to a short-term peak. Either that or the S&P500's
downtrend in terms of gold that began in August of 2000 is about to end.
With the market extended in the short-term
a good deal of caution should be exercised, but we do not think the overall
post-September rally is coming to an end. In our opinion, any pullback
at this time will be within the context of a continuing up-trend. As such,
we would be using any general market weakness to add to positions in the
commodity stocks recommended over the past 2 months. We are medium-term
bullish on the copper price and would thus continue to accumulate Phelps
Dodge in the US (NYSE: PD) and MIM Holdings in Australia (ASX: MIM). We
think the risk/reward ratio for natural gas producer Chesapeake Energy
(NYSE: CHK) is very attractive in the low-$6 area and feel comfortable
buying diversified commodity producer BHP Billiton (ASX: BHP) below A$9.50.
We've recently added Occidental Petroleum (NYSE: OXY) to provide some exposure
to the oil sector and this stock can also be accumulated on weakness over
the next few weeks. Note that both PD and CHK are well down from the levels
at which they traded during the first half of this year and so they may
be adversely affected by tax-loss selling between now and late-December.
Any short-term weakness should be considered as a buying opportunity because
these commodity-cyclical stocks should perform very well during the first
quarter of next year. Another stock that we will add if the price is right
is palladium-producer Stillwater Mining (NYSE: SWC). We plan to buy SWC
if it becomes available in the $10-$12 range between now and year-end.
We emphasise that buying should only
be done during weakness. Our recommended commodity stocks are attractively
priced at current levels, but these stocks will not be immune to the effects
of a general market decline.
This week's important economic/market
events
| Date |
Description |
| Tuesday November 27 |
Existing Home Sales
Commitments' of Traders Report (delayed) |
| Wednesday November 28 |
Fed's Beige Book (survey of economic
activity) |
| Thursday November 29 |
Durable Goods Orders
New Home Sales |
| Friday November 30 |
Q3 GDP Report |
Gold and
the Dollar
The Dollar
We should always assume that a technical
breakout is valid until proven otherwise, even if the breakout does not
seem to make any sense based on our view of the financial world. For example,
the Dollar's upside breakout on Oct-11 signaled that an extended rebound
was in progress. This breakout did not alter our longer-term bearish view
on the Dollar, but it did cause us to deviate from our short-term bearish
view.
From the Oct-22 WMU: "The fundamentals
for the US Dollar were lousy prior to Sep-11 and have worsened as a result
of the past month's explosion in the US money supply. Since today's conventional
wisdom seems to be that no amount of Dollar-supply increase is a problem
unless the CPI is rocketing skyward, there will be no pressure on the Fed
to deviate from its inflationary policies over at least the next few months.
This means that the US' inflation problem is going to get much worse and
will eventually result in a much lower Dollar. However, this doesn't mean
that a Dollar collapse is imminent. Recall that the US stock market peaked
on Mar-24 last year, but that by the end of August the S&P500 had returned
to near its peak. It wasn't until almost 6 months after the March 2000
peak that the stock market began to accelerate lower. It is possible that
a similar scenario could be developing with the Dollar.
It is likely that the Dollar Index
made a long-term peak in early July this year and is presently immersed
in a bear market that will last well into next year, but the Dollar's recent
trading action could be signaling that an extended rebound is in progress.
In last week's WMU we noted that the Dollar Index had broken upwards out
of its downward-sloping channel, thus providing some evidence that a substantial
recovery was afoot. By working higher over the past week, despite being
overbought, the Dollar Index consolidated its upside breakout."
Considering the outlook for the Dollar
in light of the outlook for the stock and bond markets discussed earlier
in today's commentary, it is quite possible that the Dollar could remain
strong into the first quarter of next year. As is the case with the stock
market, any near-term pullback will most likely be in the context of a
continuing up-trend.
As far as reasons for the Dollar's
strength, here are two possibilities. Firstly, a disaster can sometimes
lead to short-term strength in a currency. For example, the Kobe earthquake
provided the impetus for the Yen's final upward surge in 1995 because it
led to massive capital repatriation to Japan. Similarly, the Sep-11 terrorist
attacks on the US have temporarily changed capital flows in a way that
benefits the Dollar (for example, the large reduction in the September
trade deficit was solely the result of insurance payments related to Sep-11).
Secondly, the Japanese have been aggressive buyers of Dollars over the
past two months, primarily due to the Bank of Japan's desperate attempts
to weaken the Yen.
Gold and Gold Stocks
We've been heavily overweight the gold
sector over the past 12 months. Based on the performance of the gold sector
relative to any other sector of the market, this has clearly been the right
thing to do. However, not everything has gone according to plan this year
as far as gold and gold stocks are concerned. For example, back in February
we forecast that the XAU would rally to around 90 within 3-6 months of
breaking above its short-term downtrend. That trendline break occurred
in April, but the XAU has never traded above the high 60s. Also, we had
projected that a break of the 6-year downtrend in the gold price would
result in a quick rally to resistance at around $325, but when the breakout
occurred in September the rally halted in the mid-290s. Was this the result
of government intervention? Probably, but that is beside the point. No
amount of intervention will be sufficient to curtail the rally when the
'real thing' starts.
A nagging concern we have with regard
to the gold market is as follows. When a major bear market ends and a new
bull market begins, the market doesn't usually provide second and third
chances for investors to get on board at rock-bottom prices. For example,
although we don't think the stock market has just embarked on a major bull
market, the price action in the stock market is actually quite close to
what we would expect to see if this was a new bull market. Bear market
rallies are often very impressive, but so are the rallies that occur in
the early stages of major bull markets. Since the Sep-21 low the stock
market has driven higher without any meaningful pullback, thus effectively
locking-out anyone who didn't buy near the lows and has been waiting for
a pullback to get on-board. The gold market, however, keeps providing investors
with new opportunities to 'get set' at what appear to be bargain-basement
prices.
Due to the Thanksgiving holiday last
week's COT Report won't be released until this Monday, but we suspect it
will show that almost all the weak-handed speculative longs have now exited
the gold market. Also, the demand for physical gold from India is reported
to be extremely robust with gold in the low-to-mid 270s. We therefore doubt
that there will be much, if any, further downside in the gold price. It
is more likely that gold and gold stocks will rebound over the next few
weeks. The ability, or otherwise, of the gold price to decisively move
above its recent peak in the low-280s during any near-term rebound will
give us an important clue as to what to expect during the first quarter
of next year.
At this stage, based on what we see
happening in other markets we think the odds favour the gold price moving
sideways over the coming 3-4 months. The past 2 years can probably be likened
to 1970-1971 in that the gold price has been held within a tight range
with the pressure under the market steadily increasing. After the gold
price finally broke its shackles in early-1972 it rose 200% in 18 months
and there was no second, let alone third or fourth, chance to get on-board
near the lows. Gold's shackles are only ever broken during those times
when the US$ falls out of favour.
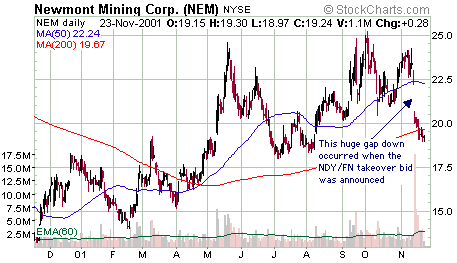
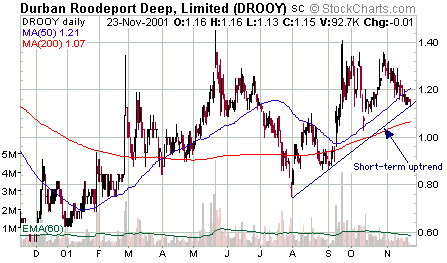
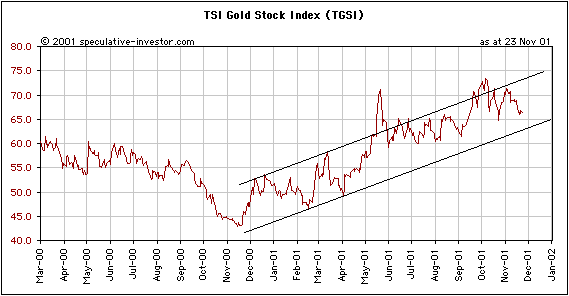
Below are charts of Newmont Mining
(NEM), Durban Deep (DROOY) and the TSI Gold Stock Index (TGSI). NEM plummeted
when the takeover bid for NDY and FN was announced and the stock is now
below its 200-day moving-average for the first time since April. However,
it is extremely oversold and should bounce over the next few weeks, probably
back to the low-20s. We would not be surprised to see Anglogold increase
its bid for NDY this week. This is something that might actually benefit
the Newmont stock price in the short-term if it is perceived that Anglo
is going to be victorious in the takeover battle. DROOY is one of the few
gold stocks that is currently in a short-term uptrend, although any further
weakness from here would break this trend. The TGSI remains comfortably
within the uptrend dating back to the November 2000 low. Nimble traders
wanting to play a near-term bounce in gold stocks could look at buying
NEM January call options or buying DROOY, in each case using the tightest
possible stop-loss.
Here are links to the daily and weekly
XAU charts provided to us by www.dingdingding.com:
Daily
XAU Chart
Weekly
XAU Chart
Summary
Rallies in the stock market and the
US$ are likely to continue through the first few months of next year, but
we are now at a time when declines (healthy pauses-to-refresh?) are highly
probable. Downward progress in the gold market has become laboured and
physical demand is strong at current levels, so there appears to be minimal
potential for further downside. If gold begins to rally over the coming
1-2 weeks, as we currently expect, the strength of the rebound and the
behaviour of inter-related markets will tell us what to expect with regard
to the first quarter of next year. (Note - we expect the silver price to
follow the gold price, but with greater volatility.)
Changes
to the TSI Portfolio
No changes, but we plan to add SSRI
if it becomes available at $1.75.

|

