|
-- for the Week Commencing 28th May 2001
Forecast
Summary
 The
Latest Forecast Summary The
Latest Forecast Summary
Inflation
Update
Growth versus Inflation, Part 2
Last week we explained that real economic
growth should result in lower long-term interest rates and that the rise
in bond yields over the past two months was therefore a result of the market
discounting higher inflation, not higher economic growth as some analysts
have contended. In his May-23 commentary, Northern Trust's Paul Kasriel
included a chart (reproduced below) that provides rather conclusive evidence
that the entire up-move in long-term interest rates over the past 2 months
has, in fact, been the result of heightened inflation expectations.
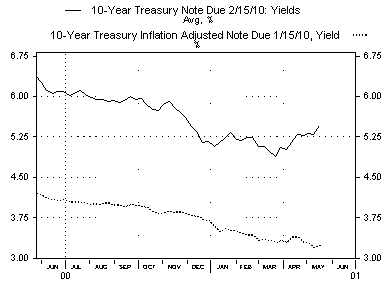
The above chart compares the yield
on the 10-year Treasury Note with the yield on the equivalent-maturity
inflation-indexed note. The only difference between the yields on these
two notes is the market's expectation regarding inflation. If the debt
market had really been discounting higher growth over the past two months
then the yield on the inflation-indexed note (the 'real' yield) should
have moved higher with the yield on the non-inflation-indexed note. In
actual fact, however, the real yield has fallen over the past two
months. This means that more than 100% of the rise in long-term
interest rates since bond yields bottomed in late-March has been due to
expectations of higher inflation. The debt market has therefore not yet
begun to discount any improvement in the economy, a conclusion that is
confirmed by the fact that short-term interest rates remain near their
lows.
The power of positive speaking
Quoting Descartes: "I think, therefore
I am". Paraphrasing Greenspan: "I say inflation is contained, therefore
it is".
Greenspan will keep telling us that
inflation is contained for as long as he can say it with a straight face
because:
a) He needs the freedom to cut interest
rates further, something he wouldn't have if inflation was widely perceived
to be a problem.
b) Money-supply growth must continue
at a fast pace in order to support asset prices and, in turn, consumer
spending. However, there is a strong inverse correlation between the money-supply
growth rate and long-term market interest rates (when bond yields trend
higher, the money-supply growth rate trends lower with a lag of 3-6 months).
As such, the Fed's goal of using monetary policy to support asset prices
and, in turn, the economy, becomes impossible if the bond market begins
anticipating much higher inflation.
There is some irony in point b) in
that the bond market sees the inflation and would actually be far more
comfortable if it perceived that the Fed also saw the inflation and was
doing something about it.
The US
Stock Market
The Trend
We like some tech stocks and think
the overall market will continue to trend higher into the final quarter
of this year, but in general we like resource stocks more than tech stocks.
Within the realm of resource stocks we like the gold stocks most of all.
We think that resource stocks will continue to out-perform the overall
market over the next 6 months and we think that gold stocks will out-perform
the other resource stocks. The reason is that gold stocks are dramatically
under-valued relative to other resource stocks, even after the recent rally.
This under-valuation, as well as providing the potential for greater upside
than, for example, oil stocks, also provides a margin of safety.
When rising long-term interest rates
cause the monetary environment to become unfavourable late this year or
early next year, we expect the entire market (including resource stocks
and gold stocks) to get hit. However, at this early stage we believe that
a secular change in the focus of investment has occurred. The stock market's
secular up-trend remains in tact, but the focus of investment is shifting
from the stocks that benefit the most from low inflation to the stocks
that benefit the most from high inflation. We expect this trend to survive
whatever stock market catharsis occurs over the coming 12-18 months because
the central banks and the private banks of the world will fight, tooth
and nail, to sustain the expansion of credit.
Current Market Situation
The rally over the past 2 months has
been based on anticipation of an economic turnaround later this year. The
Fed is perceived to be doing everything it needs to do and the money supply
is expanding rapidly, thus creating a friendly monetary environment and
setting the scene for strong corporate earnings growth next year.
We expect a correction to commence
by early June that will most likely be based on disappointment that the
economy is not yet showing any signs of recovery (as noted in previous
commentary, we should not expect any marked improvement in the economy
until at least September). Other potential catalysts are negative news
on inflation and a sharp fall in the Dollar.
The technical condition of the market
and market sentiment also point to a near-term correction. The major stock
market averages have recently confirmed strength, enticing into the market
those who like to buy after technical breakouts, and some short-term indicators
are showing dangerous levels of bullish sentiment. If the market hasn't
already reached a short-term top we would expect it to do so this week.
If we could ignore valuations and just
look at the market action, the sentiment picture and the monetary environment,
we would be very confident that the coming correction will be shallow with
the greatest risks, in the medium-term, being on the upside. In fact, if
we could ignore valuations we wouldn't have bothered taking profits on
our QQQ shares early last week and would, instead, have been prepared to
ride-out any correction. However, we can't completely ignore those pesky
valuations. We are not concerned at all about the NASDAQ Composite's 300+
P/E since tech stock P/E ratios will plummet next year when earnings growth
re-accelerates, but we are very concerned about the Dow's P/E of around
29. Many of the non-tech blue-chips will, at best, achieve earnings growth
in the single-digits or low double-digits, so current valuations are already
stretched to the limit. As such, although we expect the market to reach
significantly higher levels later this year we are going to proceed cautiously
from here on.
This week's important economic/market
events
| Date |
Description |
| Monday May 28 |
Memorial Day Holiday in the US |
| Tuesday May 29 |
Personal Income and Spending
Consumer Confidence |
| Friday June 1 |
Employment Report |
Gold and
the Dollar
Official Sector Gold Supply
The news out of Russia last Thursday
(Vladimir Putin's comment that he is considering the sale of part of Russia's
gold reserves to help victims of floods in Siberia) means that it is now
a good time to review the effect of official sector gold sales on the gold
price. Another member of the Russian Government commented on Friday that
Russia's deal with the IMF would prevent the sale of gold from the Central
Bank's reserves, so it seems that official Russian gold may not actually
hit the market. However, it is likely that news stories regarding potential,
actual, rumoured or imagined central bank gold sales will mysteriously
appear every time the gold price shows any sign of strength in the same
way that the possibility of IMF gold sales was trotted out repeatedly during
the late-1990s. So, will worries over future central bank gold sales nip
the recent gold rally in the bud?
Gold has been in a bear market for
so long that people have forgotten what happens when the investment demand
for gold is rising. An environment in which the investment demand for gold
is rising is one in which confidence in the Dollar (investment demand for
the Dollar) is falling. In such an environment a reduction in a country's
gold reserves causes a further loss of confidence and a rise in the gold
price in terms of that country's currency. That is, official sector sales
lead directly to a higher gold price. This is what happened during the
1970s - the US and the IMF tried to conceal the public face of inflation
and governmental ineptitude by auctioning huge quantities of gold.
Their objective was to reduce the gold price, but the gold price rose after
every auction. The auctions were therefore stopped. The difference between
then and anytime during the past 10 years is an intangible factor called
confidence - there has been widespread confidence in the US economy and
the US Federal Reserve over the past decade whereas there was a general
lack of confidence during the 1970s. Over the past decade official
sector gold sales were seen as another element weighing on the gold price,
whereas during the 1970s they were seen as a clear sign of central bank
weakness and government failure.
It is our belief that confidence
in the US economy and the US Federal Reserve peaked in the October-November
period last year as indicated by the blow-off top and sharp reversal in
the S&P500/XAU ratio.
In a gold bull market, what happens
if official sector gold is brought to the market surreptitiously via gold
loans that are not reported? Won't central banks be able to suppress the
price in this way? This won't be an issue because there will be very little
borrowing demand for gold in a gold bull market and without willing borrowers
gold cannot be loaned. The large-scale lending of gold by central banks
is a by-product of gold's bear market because borrowing gold is only feasible
if there is a high probability that the gold price will be the same, or
lower, when it comes time to repay the loan. That is, gold borrowing is
only feasible if the gold price is mired within a long-term downtrend.
In summary, if gold remains in a bear
market then official sector gold sales, or rumours of same, will weigh
on the gold price. If, however, gold has embarked on a new bull market
then official sector gold sales will have no lasting negative effect on
the gold price and may, in fact, have a positive effect.
News regarding actual or potential
increases in the supply of gold due to central bank sales or lending is
sure to surface from time to time and when it does it can be considered
to be a litmus test as to whether we are, or are not, in a gold bull market.
It will, first and foremost, be a test of market sentiment since the size
of any actual sales/loans will not be large enough to dampen the gold price.
After all, to put things in perspective, at the current gold price the
total value of all the gold reportedly held by central banks is about the
same as the market capitalisation of one loss-making heavily-indebted company
called AOL Time Warner.
Bull Market Comparison
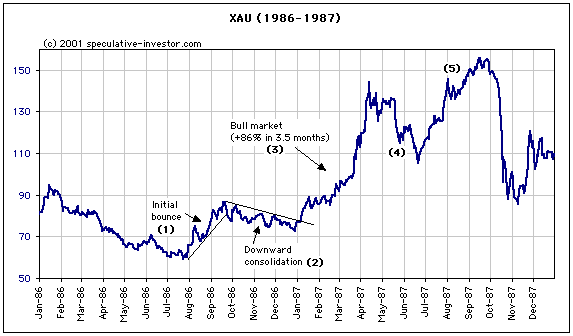
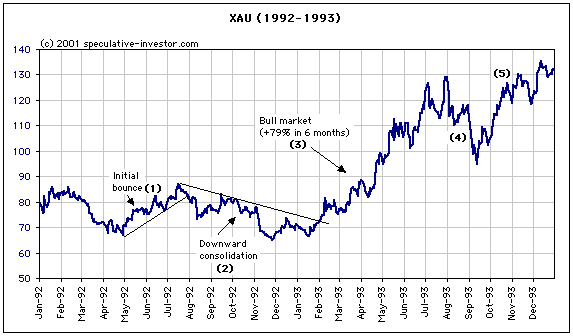
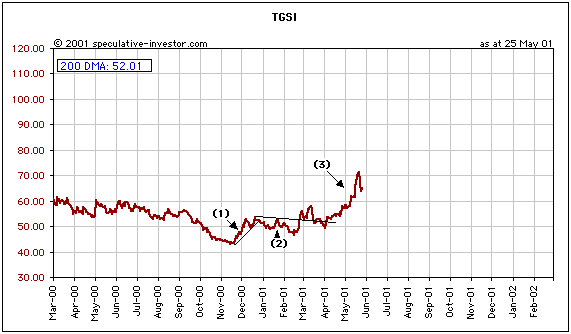
In the Feb-12 WMU we noted the similarities
between the 1986-1987 and 1992-1993 gold stock bull markets and suggested
that the coming gold stock bull market may follow a similar pattern. Below
are the charts showing the 86-87 and 92-93 XAU bull markets previously
included in the Feb-12 WMU and a chart of the TSI Gold Stock Index from
March 2000 to the present day. Apart from a false start rally in early
March this year, the current pattern continues to look similar to that
of the previous bull markets. If the similarities continue then a medium-term
peak (the Wave 3 peak) would be likely to occur around mid-July.
More on the Enigmatic Dollar
In the latest Interim Update we briefly
explained why we thought the recent strength in the US$ was not
due to flight-to-safety buying or an impending currency crisis but was,
instead, due to highly-leveraged speculations in the US credit market.
Last week's sharp rise in the Yen and counter-balancing sharp drop in the
euro support our contention. We think the following extract from Doug Noland's
latest Credit Bubble Bulletin at the Prudent Bear web site (http://216.46.231.211/credit.htm)
is 'on the money' as far as what is most likely driving the currency market.
"It is precisely because the Fed
and the GSEs are committed at all costs to sustain the bubble, and that
the contemporary US credit system has the means and willingness to perpetuate
the inflationary monetary expansion necessary to keep asset prices levitated,
that has placed the U.S. credit system firmly as the last great refuge
for the monstrous global leveraged speculating community. The speculators
have learned that liquidity is absolutely a necessity for playing, while
loving monetary inflation as long as they can profit from it. No reason
to play in Europe, with the sometimes-feisty ECB much less amenable than
the Greenspan Fed (besides, they don't have GSEs!). No safe place to play
in emerging markets, especially with the demise of pegged currency regimes
and global currency markets so unsettled. Certainly there is no reason
to play in Japan, or anywhere in Asia for that matter, with their historic
bubbles already having burst. The speculators know what they like, a central
banker that will surprise them with timely "treats," while giving them
plenty of advance warning in the unlikely event of needing to administer
a bit of a "trick". And with Greenspan and the GSEs providing assurances
of marketplace liquidity that no other country can come even close to matching,
there simply is little reason to place bets anywhere else - there's only
one hot casino left in town. The good news is that all this "hot money,"
does wonders for what should be an acutely vulnerable dollar. The bad news
is that there sure is a lot riding on what appears to be one massive and
increasingly vulnerable speculation and derivative bubble that fuel the
perpetuation of the historic U.S. Credit Bubble. I have said before that
I see the current bets placed in the U.S. interest rate market as probably
"history's most crowded trade." Furthermore, I see the dollar acutely vulnerable
when this speculation falters and the "hot money" runs for cover."
Current Market Situation
The latest Commitments of Traders data
for gold is decidedly bearish, with Commercial traders shown to be net-short
to the tune of 65,000 contracts. However, the situation could now be very
different as the latest COT report does not include the final 3 days of
last week. In particular, there was huge volume traded on Thursday following
the bogus Russian news. It will therefore be important to pay attention
to the next COT report as it will reveal the extent to which the Commercial
Traders used price weakness on Thursday and Friday to cover their 'shorts'.
The traders' commitments for the major currencies are generally Dollar-bearish
and are therefore in-line with our expectation for an imminent Dollar peak.
Thursday's low for June gold was 276
and Friday's low was 275.50, so the previous breakout level around 275
has held thus far. If 275 continues to hold it would be a very definite
sign of strength, although a drop below 275 would not be the end of the
world. The short-term movements in gold have become even less predictable
than usual, but our expectation is that the gold price will spend 1-2 weeks
consolidating in the 270-280 range before attempting an assault on $300.
Lease rates remain stubbornly high at around 2.5%, so the physical market
is still 'tight'.
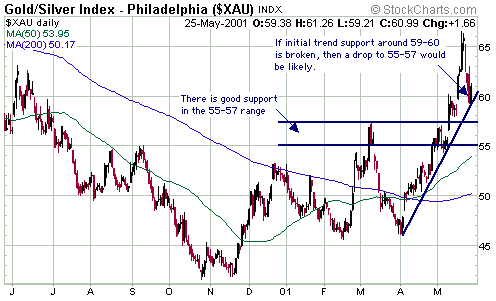
Price action in the gold stocks has,
over the past 2 months, been unequivocally bullish. We expect that the
XAU will hold in the 55-57 range on any further near-term pullbacks.
Oil Market
Update
We noted in TSI Market Alert #34, e-mailed
on May-22, that some tentative signs of an oil price peak were emerging.
The subsequent $2 per barrel drop in the oil price provides some technical
evidence that a peak is now in place.
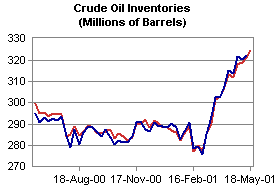
The supply-demand equation for oil
that has been so bullish for the past year is no longer supportive of a
$30 oil price. As the following chart shows, oil inventories have rocketed
higher over the past 3 months. This probably means that some OPEC countries
have been exceeding their quotas and also suggests that there has been
only a modest increase in demand. With economic growth in the industrialised
world likely to remain subdued until late this year the demand side of
the equation is not going to be a positive influence on the oil price over
the next few months.
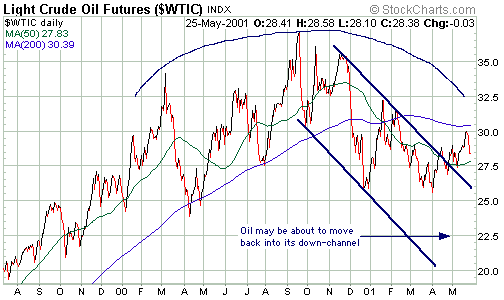
The technical picture, as illustrated
by the oil price chart included below, is consistent with the deteriorating
medium-term supply-demand fundamentals. A drop to the low-20s over the
coming 3 months would not be a surprise. A moderate decline in the oil
price over the coming months also meshes with our short-term view on bonds
- bond prices and oil prices tend to move in opposite directions and we
expect a bear-market bounce in bonds to begin during the next 1-2 weeks.
Taking a longer-term view we are still
bullish on oil and expect to see last year's highs exceeded during the
next 12 months.
Changes
to the TSI Portfolio
No changes.

|

