|
-- for the Week Commencing 29th July 2002
Forecast
Summary
 The
Latest Forecast Summary The
Latest Forecast Summary
Big Picture
View
Here is a summary of our big picture
view of the markets. Note that our short-term views may differ from our
big picture view.
Bond yields (long-term interest
rates) will move higher during 2002.
The US stock market will reach
a major bottom (well below the September-2001 lows) during the second half
of 2002.
The Dollar commenced a bear
market in July 2001 and will continue its decline into 2003.
A bull market in gold stocks
commenced in November 2000 and is likely to extend into 2003.
Commodity prices, as represented
by the CRB Index, will rally during 2002 and 2003.
The oil price will resume its
major uptrend during the first half of 2002.
Gold Market
Overview
We are going to dispense with our usual
format today and just launch straight into a ramble on the gold market.
We've read a few theories as to why
gold was hit so hard last week, one of the most popular being that the
sell-off was related to JP Morgan's huge derivative position. Also, after
such a sharp decline it is natural to question whether or not gold is still
in a bull market.
Before we get into the broader issue
regarding whether or not our "gold is in a long-term bull market" thesis
is intact, let's focus on what happened last week. The popular theory (amongst
goldbugs) is that JPM needed to force the gold price much lower in order
to mitigate the risk of major losses associated with its massive position
in gold-related derivatives. This is probably true, although it is only
part of the story.
The collapse in bank stock prices last
week indicates that the market perceives a significant risk of a banking
crisis. If the market is right then the banks are in a desperate situation
and would be expected to use all resources at their disposal to cover-up
the mistakes that have put them in such a precarious situation in the first
place. In the case of JPM a large (relative to the size of its capital)
position in gold derivatives has been accumulated over the years and this
position appears to have been undertaken on the basis that gold prices
will not rise beyond the $300-$325 range. As such, it is highly probable
that JPM and other large bullion banks have recently been doing whatever
they can to reduce the gold price. However, as we mentioned above this
is only part of the story.
The other part of the story explains
why the heavy-handed intervention in the gold market has, to date, been
successful. After all, with the financial markets in turmoil any short-selling
of gold would be extremely hazardous and could just create an even bigger
problem for the vulnerable banks and other 'shorts'. In this case, however,
it worked.
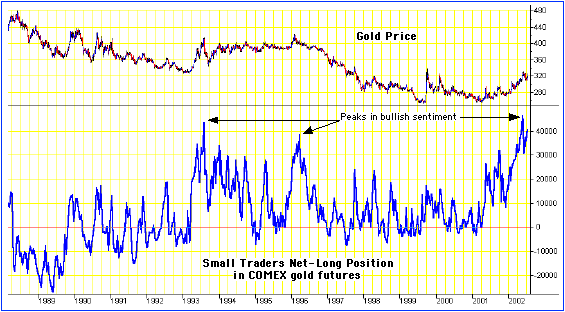
The reason it worked is that sentiment
in the gold market had become lopsidedly bullish. We know that sentiment
was lopsidedly-bullish because the net-long position of small traders in
COMEX gold futures was at an all-time high when the gold price peaked at
around $330 two months ago. Furthermore, as at 23rd July (the date of the
latest data) the small traders' net-long position was still quite close
to this all-time high even though the gold price had, by that stage, dropped
by $15 from its early-June peak. The following chart, provided courtesy
of Nick Laird at http://www.cairns.net.au/~sharefin/Markets/Charts.htm,
illustrates the 'problem'. As at 23rd July, with gold trading at $312,
the net-long position of small traders (the dumb money) was around 41,000
contracts, similar to its levels at the major gold market peaks of 1993
and 1996 and only slightly below the level reached at this year's peak.
In last week's Interim Update we said
that a brief drop below $300 would probably be needed to set the stage
for the next gold rally. This is because a break below a psychologically
important level will likely be required to cause the small traders, who
relentlessly clung to their long positions during the first $15 of gold's
correction, to give up.
The commitments of traders data are
of almost no use as far as timing the market is concerned because there
is no telling how extreme the positions will become before a trend change
occurs. However, they do help to indicate the level of risk in the market.
We've highlighted this risk on numerous occasions over the past 3 months,
although we are somewhat surprised by the resiliency being shown by the
small traders (we are surprised that only minimal 'dumb money' liquidation
occurred during the drop in the gold price from the high-320s to around
310).
Small traders being resilient in the
face of a decline in price is a bearish factor because the decline won't
end until they capitulate. So, the longer the 'dumb money' hangs on the
greater will be the duration and magnitude of the decline. Digressing for
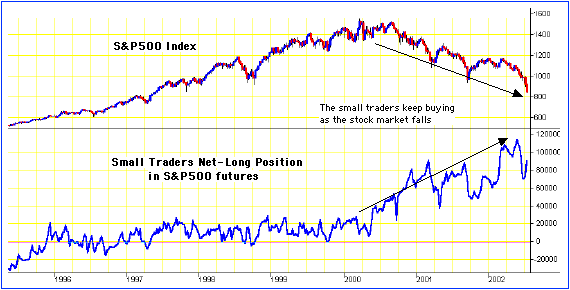
a moment, the current situation in the S&P500 futures market is quite
extraordinary in that the small traders actually increased their
net-long position by a hefty 19,000 contracts during the 2-week period
ended 23rd July, a period during which the S&P500 fell by 153
points. The following chart, also courtesy of Nick Laird, shows the persistent
bullishness of the 'dumb money' in the face of the S&P500's relentless
decline. Until these small traders finally 'throw in the towel' there is
little chance of a stock market rally lasting more than a few days.
Now to the main issue raised as a result
of last week's fall in the gold price and collapse in the prices of gold
shares, that is, the issue of whether gold's bull market has ended. The
only way that gold's bull market could possibly have ended is if the US$
has finished going down and is about to embark on another bull market.
This, in turn, could only happen if the real returns (or perceived real
returns) on US$-denominated investments make a recovery of sufficient magnitude
to enable the US to once again attract net foreign investment in-flows
of around $40B per month. Anything is, of course, possible, but such an
outcome seems unlikely in the extreme and is certainly something we feel
comfortable betting against.
We shouldn't be stubborn, however,
because we never know what we don't know, that is, there could always be
some important piece of information that we are missing. As such, we must
always make sure that price action is not in conflict with what we think
is going to happen. If it is then we should make some adjustments.
Last week all the major gold stocks
fell below what would have been ideal support levels for a normal correction,
but none of the large or mid-sized unhedged producers fell far enough to
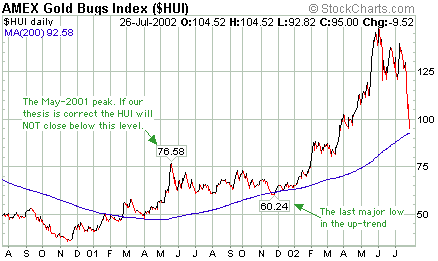
break their primary up-trends. Let's take a look at the Amex Gold BUGS
Index (HUI), a proxy for these unhedged stocks.
Below is a 2-year chart of the HUI.
Primary trend support for the HUI lies at around 60 (this was the previous
low within the 2-year up-trend), a level that is too far below Friday's
close to be of much practical value (we'd want to know that a trend change
was in the works well before the HUI fell to 60). However, if the bull
market is still intact then we should not get a daily close back below
the May-2001 closing high of 76.58. Therefore, if the HUI closes below
76 we will assume that we are missing something and will sell most of our
gold and silver stocks.
Lastly, there are a number of ways
to manage risk when trading and investing. One way is to use sell-stops
positioned just below support levels and another is to hedge via options.
We sometimes use sell-stops, but our preferred way to manage risk is to
use a scale-in/scale-out approach and to never be committed to the extent
that a sharp correction is going to put us under duress. By "scale-in/scale-out"
we mean buying in stages during periods of substantial weakness and then
taking money off the table in stages during those periods when the market
becomes 'frothy'. Not being over-committed allows a trader or investor
to focus on doing the right thing as opposed to focusing on the money.
The US
Stock Market
Current Market Situation
Based on the dramatic action in gold
last week and the lack of any change in the stock market's situation we
decided to devote most of the space in today's commentary to the gold market.
We'll just make a few brief comments on the stock market.
Firstly, as mentioned above the commitments
of traders situation has not improved despite the recent sharp decline
in the S&P500 Index. In fact, it has deteriorated.
Secondly, the NASDAQ100 Volatility
Index (VXN) and put/call ratios have yet to confirm that even a short-term
bottom has been reached.
Thirdly, following Wednesday's huge
rally the NASDAQ Composite Index and the NASDAQ100 Index have had 2 'inside'
days (days when the high and the low are within the range of the previous
day). This suggests to us that the market is preparing to make another
large move. We don't know the direction of the move, but if it is up we
would consider it to be another brief interlude within an on-going downtrend.
Fourthly, our forecast for this year
has been that a major bottom would be reached during the final few months
of the year. However, the relentless nature of the short-term downtrend
that began in March opens up the possibility that the low that occurs during
the next few weeks will be the low for this year. This would mean that
the major bottom would be postponed until well into next year. We'll explore
this possibility further in future commentaries.
This week's important economic/market
events
| Date |
Description |
| Monday July 29 |
No significant events |
| Tuesday July 30 |
Consumer Confidence |
| Wednesday July 31 |
Preliminary GDP Estimate for Q2 |
| Thursday August 01 |
ISM Index
Construction Spending |
| Friday August 02 |
Employment Report
ECRI Future Inflation Gauge
Personal Income and Expenditure |
Gold and
the Dollar
Current Market Situation
Below is a long-term monthly chart
of the Dollar Index. When the Dollar broke below its January-2001 low last
month it confirmed that a major trend change was in the works, although
at this stage it remains above the post-1995 trend-line.
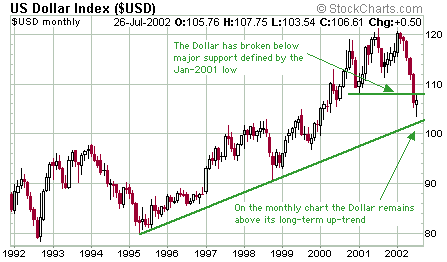
If the Dollar Index closes this month
at around its current level or higher it will achieve a monthly gain for
the first time in 6 months, that is, the sequence of consecutive down-months
will end at 5. The only other times over the past 10 years when the Dollar
Index fell for 5 months in a row occurred during the periods immediately
preceding the major Dollar bottoms in 1992 and 1995. This doesn't mean
the Dollar has reached a major bottom (we certainly don't think it has),
but it does increase the probability of a counter-trend rally lasting at
least 1-2 months.
The powerful rally in gold and gold
stocks during the first few months of this year correctly anticipated the
sharp decline in the Dollar over the past few months. The sharp decline
in gold and gold stocks over the past several weeks has probably, in turn,
discounted a Dollar rebound. As discussed earlier under "Gold Market Overview"
this decline in gold and gold stocks will eventually be seen as a correction
within an on-going bull market unless we are wrong about the Dollar, that
is, unless the Dollar has, in fact, reached a long-term bottom and is about
to commence a new bull market. With the US current account deficit at an
all-time high, with the real returns on US$-denominated assets and debt
likely to remain poor for some considerable time to come, and with policy
initiatives on the part of the US Administration designed to prop-up asset
prices and the economy likely to contribute to the US' inflation problem,
the probability of a new Dollar bull market commencing anytime soon is
extremely low.
Regardless of whether we are right
or wrong about the recent decline in gold share prices being a bull-market
correction, a short-term bottom has either already been reached or will
be reached within the next few days. Gold stocks will then bounce. After
the sort of panic sell-off that has occurred over the past week it would
be normal for a test of the low to occur some time within the ensuing 2
months, after which the next phase of the bull market will begin. The following
chart of the HUI illustrates the ideal pattern.
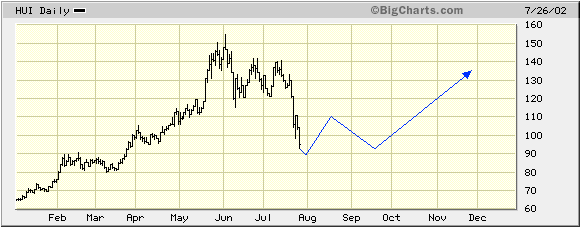
There are, of course, no guarantees
that a test of the lows will occur and that if it does occur it will be
a successful test. This is what makes it interesting and challenging.
Note that the low that was formed last
Friday, or the low that will be formed over the next few days if Friday's
low is breached, will become the highest low within the primary up-trend.
This level will then become our major 'stop-out' point. In other words,
if Friday's intra-day low of 92.82 holds and the HUI rebounds immediately
then we will set our major sell-stop at 92 as opposed to the 76 level mentioned
earlier in today's commentary.
Long-term investors should scale into
the top-quality major gold producers at around current levels, but should
not be mortgaging the final 40 acres in order to do it. In our view the
stocks of the major producers that offer the best risk/reward ratios are
HGMCY and GFI. This is because their current stock prices are fully justified
by current earnings, that is, the stocks are not discounting any
increase in the gold price. Furthermore, we expect that any additional
weakness in the gold price will occur in parallel with weakness in the
SA Rand, meaning that the earnings of Harmony and Gold Fields are naturally
hedged against a falling gold price. This doesn't mean that their stock
prices won't take a further hit (gold-stock prices are affected far more
by the US$ gold price than by the gold price in local currency terms),
but it does limit the downside because fast-growing companies never sell
at low P/E ratios for long. DROOY also looks attractive at its current
price and would be our third choice.
Before making any additional purchases
of speculative gold stocks or short-term trading positions we would wait
until a) a new short-term up-trend is confirmed, b) gold stocks begin to
out-perform the metal, and c) the net-long position of small traders in
COMEX gold futures falls below 10,000 contracts. We would also wait before
making any additional purchases of silver stocks. As was the case in the
previous gold rally, we expect the next gold rally to be led by the major
gold producers with the speculative gold stocks and the silver stocks following
along behind them.
By the way, as discussed in previous
commentaries we do not think the new SA Mineral Rights bill presents a
significant problem for either Harmony or Gold Fields. Harmony currently
has 49M ounces of reserves and 295M ounces of resources, so even if it
doesn't convert any of its vast resources into reserves it presently has
enough reserves to produce gold at the current annual rate of 3.3M ounces
per year for the next 15 years (existing assets are not jeopardised by
the new legislation). Also, even if it is prevented from acquiring any
additional assets in SA it can simply continue doing what it has been doing
for the past few years - buy gold-producing assets in Australia.
Commodities
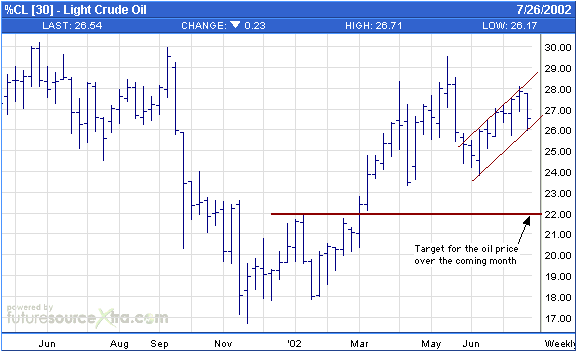
Below is a weekly chart of oil futures.
The oil price peaked in May, dropped sharply into early-June, and has since
'flagged' higher to a lower peak in July. Oil has been sporting a substantial
'war premium' over the past few months, but recent price action suggests
that this premium is about to be removed. We expect the oil price to drop
to the low-20s over the coming 1-2 months.
Below is a long-term chart of Phelps
Dodge (NYSE: PD). PD is the world's largest privately-owned copper producer
and is a highly-leveraged play on the copper price.
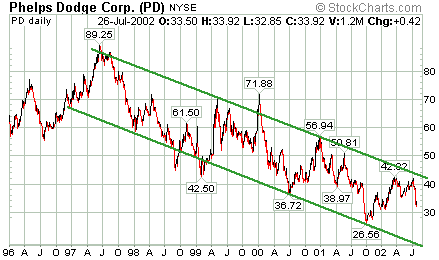
Copper futures closed last week at
68.70, about 15% above last November's low. We are confident that last
November gave us THE bottom for copper, but expect more downside in the
short-term. However, if we are right that last November's low will hold
then it is highly probable that PD will also hold above last year's low.
As such we will probably add PD to the TSI Portfolio if it falls to $28
(whether we actually do or not will depend on what is happening in the
stock, bond and currency markets at the time). A daily close above $43
is needed to break the 5-year downtrend.
Update
on Stock Selections
In the 12th June Interim Update we
did a valuation comparison of several of the major gold stocks. We plan
to update this comparison in about 2 weeks time after all the companies
have reported their June-quarter financial results.
Volatility has certainly been the order
of the day. Last week our Chesapeake Energy (CHK) traded as low as $4.50
and as high as $6.13 before closing the week at $5.50. CHK reported good
financial results during the week and at its current price it is selling
at less than 3-times operating cash-flow. Value buying will eventually
overwhelm momentum selling, but in the short-term a lot of babies are being
thrown out with the bath water.
Chart Sources
Charts used in today's commentary were
taken from the following web sites:
http://stockcharts.com/index.html
http://www.futuresource.com/

|

