|
-- Weekly Market Update for the Week Commencing 29th December 2003
Big Picture
View (Most recent update: 18 August 2003)
Here is a summary of our big picture
view of the markets. Note that our short-term views may differ from our
big picture view.
Bond yields (long-term interest
rates) reached a major low in June of 2003 and will trend higher until
at least mid 2004.
The US stock market will reach
a major bottom (well below the October-2002 low) during 2004.
The Dollar commenced a bear
market in July 2001 and will continue its decline during 2003 and 2004.
A bull market in gold stocks
commenced in November 2000 and will continue during 2003 and 2004.
Commodity prices, as represented
by the CRB Index, will rally during 2003 and 2004 with most of the upside
occurring in 2004.
Copyright
Reminder
The commentaries that appear at TSI
may not be distributed, in full or in part, without our written permission.
In particular, please note that the posting of extracts from TSI commentaries
at other web sites or providing links to TSI commentaries at other web
sites (for example, at discussion boards) without our written permission
is prohibited.
We reserve the right to immediately
terminate the subscription of any TSI subscriber who distributes the TSI
commentaries without our written permission.
Bonds
So far, it looks like the typical
post-bubble pattern
A market that has just reached a 'bubble
peak' typically follows a sequence that begins with an initial sharp decline
that bottoms about 2 months after the bubble peak. A multi-month rebound
to a secondary (lower) peak then occurs, but this rebound turns out to
be the calm before the storm because it is followed by a large and lengthy
decline.
After bonds made what looked, to us,
like a bubble peak in June of this year our expectation was that they would
end up following something similar to the above-described sequence with
an initial bottom most likely occurring in August and a secondary peak
most likely occurring during the final quarter of 2003. In fact, in the
16th July Interim Update we compared the final run-up and subsequent collapse
in the NASDAQ100 Index (NDX) during 2000 with this year's upside blow-off
and subsequent collapse in the US bond market.
There is no reason why today's post-bubble
T-Bond will necessarily follow exactly the same path as that taken by the
NDX during 2000 (there will always be enough differences between the current
market action and prior market action to keep most traders in the dark).
However, the below chart shows that the paths have, to date, been remarkably
similar (in the below chart comparison the March 2000 peak in the NDX is
lined up with the June 2003 peak in the T-Bond).
Up until the past few weeks the twists
and turns of the post-bubble bond price have roughly matched the twists
and turns of the post-bubble NDX, but a difference is now emerging. Specifically,
at this stage of its bear market the NDX had just embarked on the second
leg of its bear market (the first leg being the initial sharp decline following
the bubble peak) while the T-Bond is still rebounding from its initial
drubbing. This difference is probably not significant, though, because
there is no fixed duration for the rebound that follows the initial sharp
decline. For example, the NDX rallied for about 3.5 months after reaching
an initial low in May of 2000 whereas the Dow Industrials Index rallied
for almost 6 months after reaching its initial bear market low during the
crash of 1929. In other words, it would not be unprecedented for the rebound
in the T-Bond to continue into the first quarter of 2004. What we can say,
at this stage, is that the T-Bond does appear to be following the typical
post-bubble pattern, which means that a break of the short-term up-trend
shown on the above chart is likely to be followed by a large and lengthy
decline.
Central bank support
Central banks -- mainly those of Japan
and China -- have provided a great deal of support to the US bond market
over the past year as a byproduct of their attempts to manage currency
exchange rates. And this support is likely to continue until the inflationary
effects of 'currency management' are perceived to be troublesome or until
the US$ stops falling.
In the absence of the massive buying
of US bonds on the part of Asian central banks that has occurred and continues
to occur, the US T-Bond price would be much lower (long-term interest rates
in the US would be much higher) and the Fed would most likely have already
begun to hike the official interest rate. As things currently stand, though,
one of the economy's built-in safety devices -- the bond market -- has
been temporarily disabled. This, in turn, is making it possible for gold
and commodity prices to move higher than would otherwise be the case. Why?
Because the way the world has worked, up until now, is that large rallies
in commodity prices have led to substantial rises in long-term interest
rates and rising long-term interest rates have prompted the Fed to tighten
monetary policy. Tighter monetary policy eventually brings about a reduction
in the demand for commodities and commodity prices begin to fall. In this
respect rising commodity prices have, during previous cycles, sown the
seeds of their own downward reversal. However, in today's world the aggressive
buying of US bonds by the Bank of Japan et al prevents long-term interest
rates from responding to rising commodity prices in the normal way. One
of the most important limiters of commodity-price rallies has therefore
been temporarily removed.
We say "temporarily removed" because
if commodity prices continue to rise then at some point private-sector
selling of bonds will overwhelm central-bank buying or the Asian central
banks will come to the realisation that the inflationary effects of their
bond-buying outweigh any benefits they hope to achieve.
Now, the Bank of Japan and the other
influential central-bank supporters of the US bond market are only accumulating
massive holdings of US bonds as a result of their efforts to prevent their
own currencies from rising relative to the US$. Foreign central bank support
for US bonds would therefore evaporate -- allowing US Treasuries to trade
based on their own dismal fundamentals -- if the US$ were to rebound or
simply stop falling. In other words, in the current topsy-turvy financial
environment the worst thing that could happen to the US bond market is
a stabilisation of the Dollar. If the Dollar were to stop falling, even
for just a few months, then bonds would have a lot of catching up to do
(to get from their present artificially-elevated level to where they should
be based on economic realities).
Oil and Bonds
Over the past two years the T-Bond
price has followed the oil price with a lag of 3-4 months. Therefore, the
recent upside breakout in the oil price is a bullish omen for bonds assuming
the aforementioned positive correlation between bonds and oil remains in
effect.
We expect that the positive correlation
will remain in effect and that some follow-through to the upside by the
oil price would eventually (after a lag of a few months) help push the
bond price higher. However, we are more than a little skeptical with regard
to the sustainability of oil's recent upside breakout. This is because
the main driver of strength in the US$ oil price appears to be US$ weakness,
which means that a rebound in the US$ would likely result in a drop in
the oil price. This is significant because a US$ rebound will probably
commence in the near future.
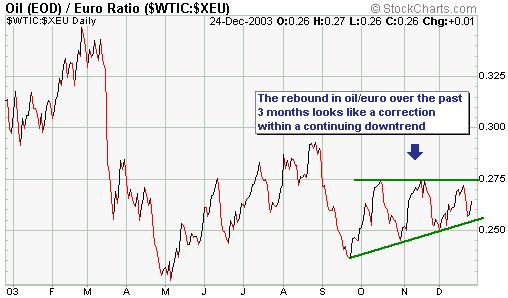
We say that the recent strength in
the oil price is mostly a function of US$ weakness because there is no
evidence of strength when the oil price is measured in terms of a strong
currency. The below chart of the oil price in terms of the euro illustrates
this point.
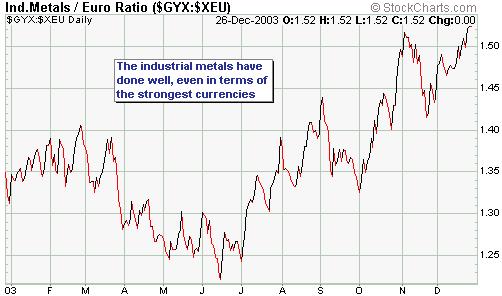
Now compare the above oil/euro chart
with the below GYX/euro chart (GYX is an index of industrial metals prices).
The industrial metals have been trending higher against the strong currencies
as well as the weak currencies, so there is clearly a lot more to the bull
market in the metals than just US$ weakness (meaning that the bull market
won't be de-railed by a US$ recovery).
Conclusion
There are more than the usual number
of crosscurrents affecting the bond market (and, therefore, interest rates)
at the present time, but at this stage we don't see any need to adjust
our intermediate-term bond and interest rate forecasts. Our expectation
continues to be that the next big move in the bond market will be to the
downside (roughly in line with the typical post-bubble pattern) and that
rising long-term interest rates will force the Fed to do what they don't
want to do (increase the Fed Funds Rate).
The greatest influence on US bond prices
over the next several months is likely to be the US$ as further dollar
weakness will result in foreign central banks absorbing a large quantity
of US bonds while a US$ rebound will remove this central bank support and
allow bonds to fall under the weight of their own over-valuation. If the
US$ does remain weak we doubt that this weakness and the resultant central
bank buying of US bonds could reverse the long-term trend in the bond market
from down to up, but it could extend the current counter-trend move.
The US
Stock Market
Current Market Situation
The below chart of the S&P500/gold
ratio shows the downward-sloping channel that originated during the early
part of 2000. S&P500/gold has successfully tested the top of this long-term
channel on two occasions over the past 6 months and remains 'channel-bound'.
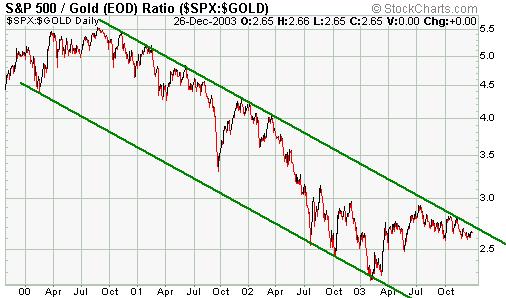
While a longer-term chart of S&P500/gold
shows an on-going downward trend, a 1-year chart (see below) reveals some
bullish potential. In particular, the decline since the July peak looks
more like a consolidation pattern within a continuing intermediate-term
up-trend than the early stages of a new intermediate-term downtrend.
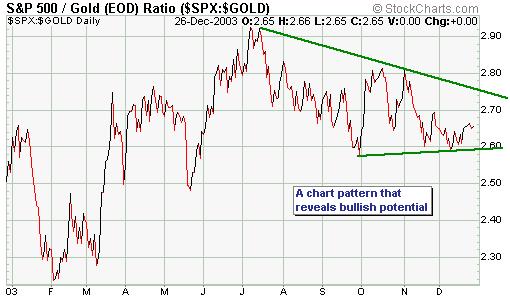
We are going to be watching the S&P500/gold
ratio more closely than usual over the next few weeks because it would
not require much movement in the S&P500 relative to gold to generate
an important upside breakout or to provide some evidence that the longer-term
downward trend remains in force. To be specific, a move above 2.75 would
break both the short-term downward trend and the 4-year downward trend
whereas a move below 2.58 would negate the bullish potential suggested
by the shorter-term chart.
The below chart needs no explanation,
but we'll provide one anyway. When the stock market was moving lower during
the first quarter of 2003 the NDX/Dow ratio was moving higher. As stated
at TSI at the time, this divergence suggested that the S&P500's test
of its October-2002 low was going to be successful. At the current time
a similar divergence is on the go except that now NDX/Dow is drifting lower
even though the stock market appears, on the surface, to be strong. In
our view this is a sign that the market is very close to an important peak.

The market will probably move a bit
higher over the coming week because the short-term trend is up and we are
in a seasonally strong time of the year. However, we will consider any
strength over the next 1-2 weeks that does not eliminate the above-described
divergence to be an invitation to increase the size of our bearish bet.
This week's important economic events
| Date |
Description |
| Monday Dec 29 |
No significant events |
| Tuesday Dec 30 |
Consumer Confidence
Existing Home Sales |
| Wednesday Dec 31 |
No significant events |
| Thursday Jan 01 |
Markets closed for New Year |
| Friday Jan 02 |
ECRI Future Inflation Gauge
ISM Index |
 Click
here to read the rest of today's commentary Click
here to read the rest of today's commentary

|
