|
-- for the Week Commencing 30th December 2002
Forecast
Summary
 The
Latest Forecast Summary The
Latest Forecast Summary
Big Picture
View
Here is a summary of our big picture
view of the markets. Note that our short-term views may differ from our
big picture view.
Bond yields (long-term interest
rates) will move below their 2002 lows during the first half of 2003.
The US stock market will reach
a major bottom (well below the October-2002 low) during 2003.
The Dollar commenced a bear
market in July 2001 and will continue its decline during 2003.
A bull market in gold stocks
commenced in November 2000 and will continue during 2003.
Commodity prices, as represented
by the CRB Index, will rally during 2003 and 2004 with most of the upside
occurring in 2004.
An appropriate
quote
"The first panacea for a mismanaged
nation is inflation of the currency; the second is war. Both bring a temporary
prosperity; both bring a permanent ruin. But both are the refuge of political
and economic opportunists."
-- Ernest Hemingway
China -
the other side of the story
Over the past several months we've
read many articles that discuss China's emergence as a major economic power
and the threat that China's economic growth poses to the US. There is,
however, another side to the 'China story' that has received very little
attention in the recent past. The other side of the story deals with massive
and increasing unemployment, a potentially insolvent banking system, over-stated
economic growth, corruption on a huge scale, lack of profits, the absence
of an objective and effective legal system, and falling productivity.
Here is a link to an article explaining
why, over the next few years, China is more likely to experience an economic
implosion than a substantial economic expansion: http://www.tnr.com/docprint.mhtml?i=20021216&s=kurlantzick121602
(you will need to register to access the article). Some of the article's
main points are:
a) The Chinese Government usually claims
annual GDP growth of 7-10%, but such growth rates are inconsistent with
China's rising unemployment and falling energy usage. The main reason that
the reported national GDP growth figures are far from reality is that the
national figures are compiled from provincial figures that are, in turn,
'manufactured' by local Party officials to meet targets set by Beijing.
b) According to Joe Studwell, editor
of the China Economic Quarterly, less than 10% of the foreign companies
that sell to China are making a profit on their China business.
c) China's banks are directed to support
inefficient and loss-making State Owned Enterprises (SOEs). As a result,
it is estimated that more than 50% of the bank loans in China are non-performing.
Standard and Poor's estimates that it will take at least US$540B to re-capitalise
the Chinese banking system and Nicholas R. Lardy, a China specialist at
the Brookings Institution, predicts that the rising burden of non-performing
loans could make the country's entire banking system insolvent by 2008.
d) With the banks being weighed down
by bad loans and the on-going need to 'prop up' uneconomic SOEs, many private
businesses with good prospects are often unable to borrow the money they
need to grow.
e) The government's auditing body has
admitted that more than two-thirds of China's biggest companies falsify
their accounting.
f) China's rating on the World Competitiveness
Scoreboard, a ranking of powerful countries based on efficiency of economic
performance, has fallen sharply over the past five years, from 21 to 31,
a drop that signifies China's economy is becoming less efficient and competitive.
g) China's economy is becoming dependent
on massive government deficit-spending (during the first three quarters
of 2002 government expenditures rose by around 20%).
h) The rule of law has deteriorated
and most independent-minded judges dedicated to creating a proper legal
system have either quit or been dismissed. As such, most legal decisions
follow the 'Party line'.
i) China is likely to experience increasing
social unrest due to its unemployment problem and the brewing crisis in
its banking system.
Our purpose in mentioning the above
is to warn that the generally bullish outlook for China that is now commonly
portrayed in the Western press should not be accepted blindly. China is
confronting some major obstacles and there does not appear to be any way
that it can transition smoothly from where it is now to the economic powerhouse
that some commentators have speculated it will become. The downside risk
appears to be substantial and we would therefore steer clear of, or tread
lightly when it comes to, mutual funds that invest in stocks listed on
the Chinese stock market.
In addition to a fundamental picture
that looks murky at best, the Chinese stock market (as represented by the
Shanghai Stock Exchange Composite Index) looks bearish from a technical
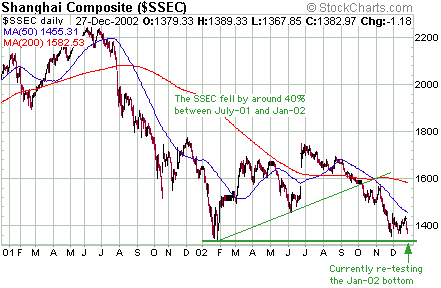
perspective. The Shanghai Stock Index (SSEC), which regularly moves counter
to the major stock markets of the world, has been in a powerful bear market
since peaking in June of 2001 (see chart below). More to the point, an
end to the bear market does not appear to be close at hand.

Regardless of whether or not China
is able to achieve, rather than just report, economic progress over the
next few years, as more and more goods are manufactured in China the global
demand for commodities is likely to rise. As such, China's internal economic
troubles don't appear to present an imminent threat to the budding bull
market in commodities.
Bonds
In terms of price movement not much
happened while we were on vacation during the past week (thankfully), but
two very important technical developments did occur. One was the Dollar
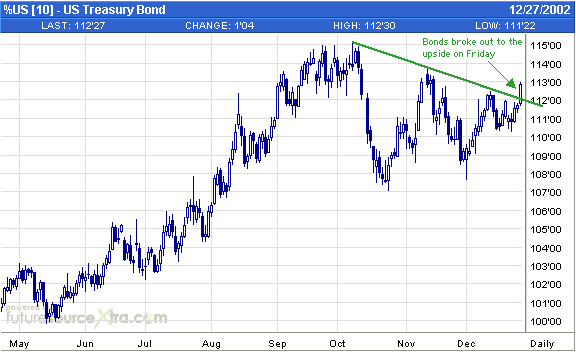
Index's decisive breakdown below its July low. The other was the upside
breakout in the bond market that occurred last Friday.
From the 23rd December Weekly Update:
"...if the next decline in the bond market holds at, or above, the uptrend-line
on this chart, or if bonds move decisively above the downtrend-line at
any time, then our medium-term bearish view is wrong. If this proves to
be the case you can be sure that we won't stay wrong." As the following
updated version of the aforementioned chart shows, bonds moved decisively
above their downtrend-line at the end of last week. As such, the odds are
now in favour of the bond price moving above this year's peak at some point
during the next 6 months.

What does the upside breakout in the
bond market mean? First, it means that our medium-term bearish view on
the stock market is probably correct (we doubt that bonds would be showing
signs of moving to new highs unless the stock indices were headed for new
lows). Second, it could mean that the biggest gains in commodity prices
won't occur until 2004. Third, it might be further confirmation that the
market has taken recent comments by Fed Chairman Greenspan and Fed Governor
Bernanke to heart.
Greenspan and Bernanke have recently
mentioned that the Fed could, and would, go well beyond its normal procedure
of setting a short-term interest rate if it was felt that falling prices
were becoming a problem for the US economy. Along these lines both Bernanke
and Greenspan have broached the possibility that the Fed would, under certain
conditions, start targeting long-term interest rates (up until now these
have been set by the market). For example, rather than simply adjust bank
reserves to keep the Fed Funds Rate at a target level, the Fed would start
buying long-term bonds with the aim of bringing long-term interest rates
down to some arbitrary level. Since the Fed has the wherewithal to buy
the entire US bond market tomorrow if it chose to do so, it certainly has
the power to force long-term interest rates down. Of course, if the Fed
forced rates below where they would otherwise be then the Fed would eventually
become the only buyer of US bonds and everyone else would sell because
the real returns on US bonds would become prohibitively low. As such, one
effect of the Fed following through with its recently-stated idea of targeting
long-term interest rates is that the US$ would collapse as foreign investors
fled the US bond market. Last week's breakouts in bonds and the dollar
(up for bonds, down for the dollar) might therefore be linked.
The US
Stock Market
Too many bulls
There is still a lot of talk along
the lines that the low reached on 10th October was either the major low
for this bear market or at least a low from which a 1-2 year bull market
will evolve. However, even if we put aside the fact that valuations are
still much closer to what would normally occur near a bull market peak
than a bear market bottom and the fact that sentiment never reached the
sort of bearish extreme normally seen near important bottoms, we would
still have a hard time accepting the bullish argument. This is because
the price and volume action since 10th October is not consistent with what
would normally occur in the early stages of a new bull market. It is, however,
totally consistent with what we would expect to see in a 'run of the mill'
bear market rally. In fact, all that has really happened since the market
reached its closing low on 9th October is a 4-day rally. On 15th October,
4 days into what many people believe to be a new bull market, the S&P500
Index closed at 881. At the end of last week it closed at 875.
So, why are so many people so bullish?
After all, the market seems to have nothing going for it. Valuations are
generally excessive, price/volume action and market breadth have been unimpressive,
and the geopolitical situation is unstable to say the least.
The underlying bullishness appears
to be based mainly on timing factors such as a) the market hasn't fallen
for 4 years in a row during the past 70 years, b) the 4-year and 20-year
cycles were due to bottom in the second half of 2002, and c) the third
year of a presidential term is usually a good one for the stock market.
Also, some analysts have justified the high valuations by arguing that
low interest rates mean it's OK for stocks to trade at much higher PE ratios
than they ever have in the past. In other words the bullish case is flimsy,
but if someone has a bullish bias they will usually be able to find some
reason to buy, or to remain long, even when the evidence is stacked against
them.
Current Market Situation
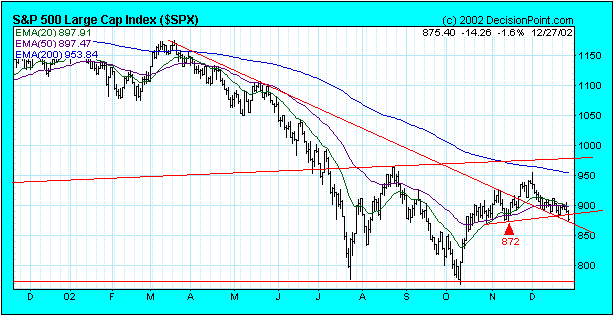
The S&P500 Index has not yet closed
below 872, the November pullback low, and has therefore not provided definitive
confirmation that the bear market rally has ended. Last Friday it did,
however, close below support defined by a short-term uptrend-line (see
chart below). Furthermore, Friday's upside breakout in bonds is certainly
a negative omen for stocks.

The S&P500 doesn't look particularly
healthy when measured in terms of the dollar, but it looks downright sick
when measured in terms of hard money.
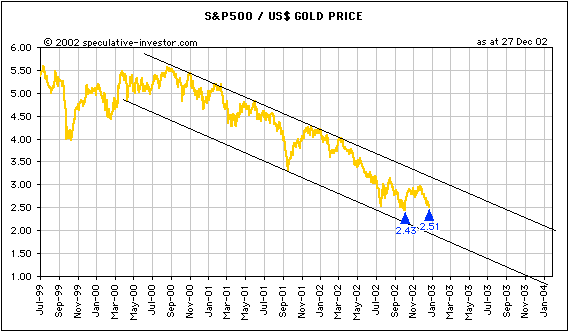
Below is a chart showing the S&P500
in terms of gold. While the S&P500 Index in dollar terms is still marginally
above its November low, the S&P500 in gold terms has fallen to within
3% of its October low. Also, note how weak the rally that began in October
of this year has been compared to the rally that began in September of
2001. During the final quarter of 2001 the S&P500/gold ratio surged
to the top of its major downward-sloping channel before it started to roll
over whereas the current rally didn't make it to anywhere near the channel
top before the downtrend resumed.

A drop to the channel bottom shown
on the above chart looks likely during the first half of 2003.
In our view the two most likely scenarios
over the next few months are:
1. The market makes a short-term bottom
during the coming week, rallies for 2-3 weeks to convince the majority
of participants that the worst is over, then resumes its decline. This
would be similar to what happened in 2001 when a 2-3 week January rally
was followed by a 2-month plunge, which, in turn, resulted in a tradable
bottom in early-April.
2. The market plunges during January
and February.
Both scenarios are clearly bearish
with the main difference being that Scenario 2 results in a tradable bottom
1-2 months earlier than Scenario 1. Unless you are a short-term trader,
though, the market's twists and turns don't really matter. The main point
is that regardless of whether we look at the market from a fundamental
or a technical perspective, there still appears to be considerable downside
risk. There are a lot of different paths the market might take to get from
where it is now to where it is going and we'll do our best to figure out
the details, but the final destination is a long way below the current
level.
This week's important economic/market
events
| Date |
Description |
| Monday December 30 |
Existing Home Sales |
| Tuesday December 31 |
Consumer Confidence
Chicago PMI |
| Wednesday January 01 |
Markets closed for New Year's Day |
| Thursday January 02 |
ISM Index (formerly NAPM) |
| Friday January 03 |
ECRI Future Inflation Gauge
Construction Spending |
 Click
here to read the rest of today's commentary Click
here to read the rest of today's commentary

|

