|
-- Weekly Market Update for the Week Commencing 31st March 2003
Forecast
Summary
 The
Latest Forecast Summary (no change from previous update) The
Latest Forecast Summary (no change from previous update)
Big Picture
View
Here is a summary of our big picture
view of the markets. Note that our short-term views may differ from our
big picture view.
Bond yields (long-term interest
rates) will move below their 2002 lows during the first half of 2003.
The US stock market will move
well below the October-2002 low during 2003, but a major bottom won't occur
until 2004.
The Dollar commenced a bear
market in July 2001 and will continue its decline during 2003 and 2004.
A bull market in gold stocks
commenced in November 2000 and will continue during 2003 and 2004.
Commodity prices, as represented
by the CRB Index, will rally during 2003 and 2004 with most of the upside
occurring in 2004.
The message
from the COT Report
In the 24th March Weekly Update we
discussed some of the potentially important changes in the positions of
the commercial traders (the 'smart money') and the small traders (the 'dumb
money') that had recently occurred. In particular, we noted that the 18th
March Commitments of Traders (COT) Report (the latest available report
at that time) had revealed substantial reductions in the commercial net-short
positions in gold futures, Swiss Franc futures and (strangely enough) S&P500
futures. The commitments were hence well on their way to becoming bullish
for gold and the US stock market and bearish for the US$ (relative to the
SF).
There were further substantial and,
we think, important, changes revealed in the latest COT Report. From our
perspective, the most interesting of these were:
a) Between the 18th March and 25th
March (the dates of the two latest COT Reports), the gold price dropped
by around $9/ounce, but there was no significant change in the commercial
net-short position. There was, however, a substantial decline in the net-long
position of the small traders. In fact, the net-long position of the small
traders in COMEX gold futures has fallen to its lowest level since March
of 2002 (see chart below). In other words, the dumb money is now less bullish
on gold than it has been at any time since March of last year (when, by
the way, the gold price was around $290).

The drop in the net-long position of
small traders was offset by a corresponding rise in the net-long position
of the large speculators. We categorise both the commercials and the large
speculators as 'smart money', so the smart money has bought gold's drop
to major support while the hapless small traders appear to have once again
exited at exactly the wrong time.
b) After being net-short the Swiss
Franc to the tune of 37,000 contracts just 2 weeks ago and net-short by
11,000 contracts 1 week ago, the commercials are now (according to the
25th March COT Report) slightly net-long the Swiss Franc. This confirms
what we said in last week's Update, that is, that the best part of the
Dollar's rebound is most likely behind us.
c) The pattern of 'smart money' buying
and 'dumb money' selling of S&P500 futures continued over the latest
week. In last week's Update we pointed out that there had been substantial
reductions in the net-short position of the commercial traders and the
net-long position of small traders during the week ended 18th March. This
was an unusual development because the commercials rarely buy and the small
traders rarely sell when the market is rising, yet the S&P500 gained
65 points during the week in question. During the 5 trading days covered
by the latest COT Report the S&P500 made only a marginal gain, but
the commercials continued to buy while the small traders continued to sell.
The upshot is that the commercials now have a net-long position in S&P500
futures for the first time since May of 2000 and the small traders are
less bullish than they have been at any time since May of 2000 (see chart
below).

The overall message from the COT Report
is rather confusing from an inter-market perspective in that it is bullish
for the stock market yet bearish for the US$ relative to safe-haven currencies
such as the SF and gold. The COT Report is, however, just one piece of
the puzzle and must be considered in conjunction with other sentiment indicators,
price action and fundamentals.
The Money
Supply
The US financial establishment has
managed to do what its Japanese counterpart couldn't do - during the 3
years following the bursting of the US stock market bubble the US financial
establishment has managed to keep the US money supply growing at a rapid
rate. Another way of saying this is that the stock market bubble might
have burst, but the underlying credit bubble has been kept alive. Some
ramifications of this are that a) the US real estate market has remained
strong throughout the trials and tribulations of the past 3 years, b) the
US stock market has avoided the type of massive selling climax that would
otherwise have occurred by now, c) the US current account deficit has continued
to expand, d) the US$ has been weakening relative to commodities and the
less-inflated fiat currencies, and e) the US economy has not experienced
a severe recession.
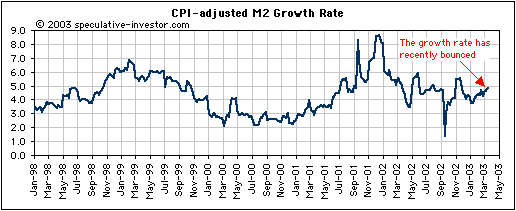
The on-going expansion of the US money
supply hasn't solved any problems, it has just ensured that even bigger
problems will be faced at some future date. A few months ago it appeared
as though that "future date" would almost certainly occur this year. However,
the below chart reveals a recent up-tick in the CPI-adjusted money supply
(M2) growth rate, so perhaps it is still too early to start writing the
credit bubble's obituary.
The US
Stock Market
A picture of frustration
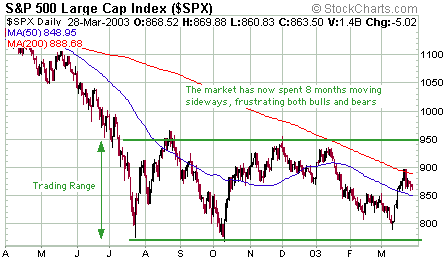
Over the past 8 months the US stock
market has been frustrating for both bulls and bears because there has
been no follow-through in either direction. As the below chart shows, the
S&P500 Index entered a trading range last July and since then it has
simply moved back and forth within this range. Our expectation is that
the top of the 8-month trading range will be tested over the coming month
or so before the start of a major decline that takes the S&P500 well
below the bottom of the range.
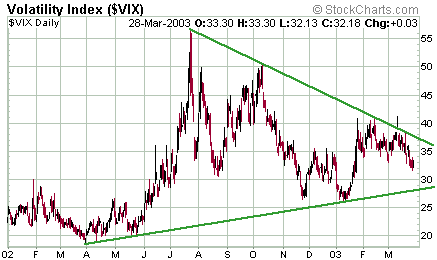
The below chart of the OEX Volatility
Index (VIX) also illustrates the indecisive nature of the recent market
environment. As the market has traded sideways, the implied volatility
of the market as measured by the VIX has moved within a contracting range.
We don't think it is appropriate to analyse the chart of a sentiment indicator
such as the VIX in the same way that a stock-price chart would be analysed,
but the below chart does make the point that there hasn't been a major
peak or a major trough in volatility over the past several months. This,
in turn, suggests that neither bulls nor bears have been able to sustain
an advantage.
Current Market Situation
Below are two charts of the NASDAQ
Composite Index. The first chart highlights the downward-sloping channel
that has been in force over the past 2 years while the second chart zooms
in on the past 6 months.
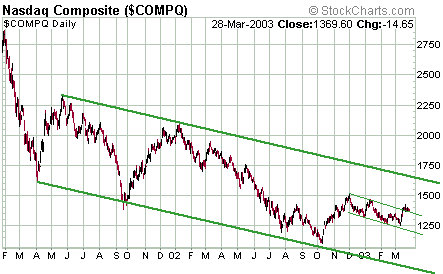
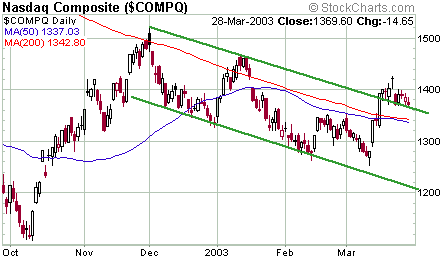
During the week before last the NASDAQ
broke upwards out of a short-term downtrend, projecting a move up to around
1550 over the coming 1-2 months. Last week it pulled back in what currently
looks like a normal test of the breakout.
If the NASDAQ can continue to hold
above its former short-term downtrend during the additional consolidation
that is likely to occur over the next week or two, then a subsequent move
up to the 1550-1600 range will become a high probability. Note that the
top of the longer-term channel shown on the first of the above charts will
be at around the 1600 level at the end of April. Given the market's lousy
fundamentals, the current low equity-fund cash levels and the strong likelihood
that a rise of this magnitude would create almost universal belief that
the bear market had ended, the probability of the NASDAQ moving beyond
the top of the longer-term channel over the next few months is extremely
low. A far more likely outcome is that a move to the channel top will be
followed by a drop to the channel bottom. This means that if a rally to
the 1550-1600 range does occur as currently expected it will likely present
us with a wonderful short-selling opportunity.
Considering the news backdrop (the
prospect of a drawn-out war in Iraq, the severe form of pneumonia that
has broken out in some parts of the world, falling consumer confidence
and the generally uninspiring economic data) it is almost inconceivable
that the market will rally at all over the next few weeks. However, the
news tends to follow the market, not the other way around.
At the current time the best approach
for investors is to remain out of the market altogether. And, until the
focus starts to shift away from Iraq and back towards the problems that
caused the bear market in the first place, the best approach for most traders
will also be to stay on the sidelines. We are, however, going to suggest
one potential long-side speculation with a reasonable risk/reward ratio
(see "Update on Stock Selections" for details).
This week's important economic/market
events
| Date |
Description |
| Monday March 31 |
No significant events |
| Tuesday April 01 |
ISM Index
Construction Spending |
| Wednesday April 02 |
No significant events |
| Thursday April 03 |
ISM Non-Manufacturing Index |
| Friday April 04 |
Employment Report
ECRI Future Inflation Gauge |
 Click
here to read the rest of today's commentary Click
here to read the rest of today's commentary

|

